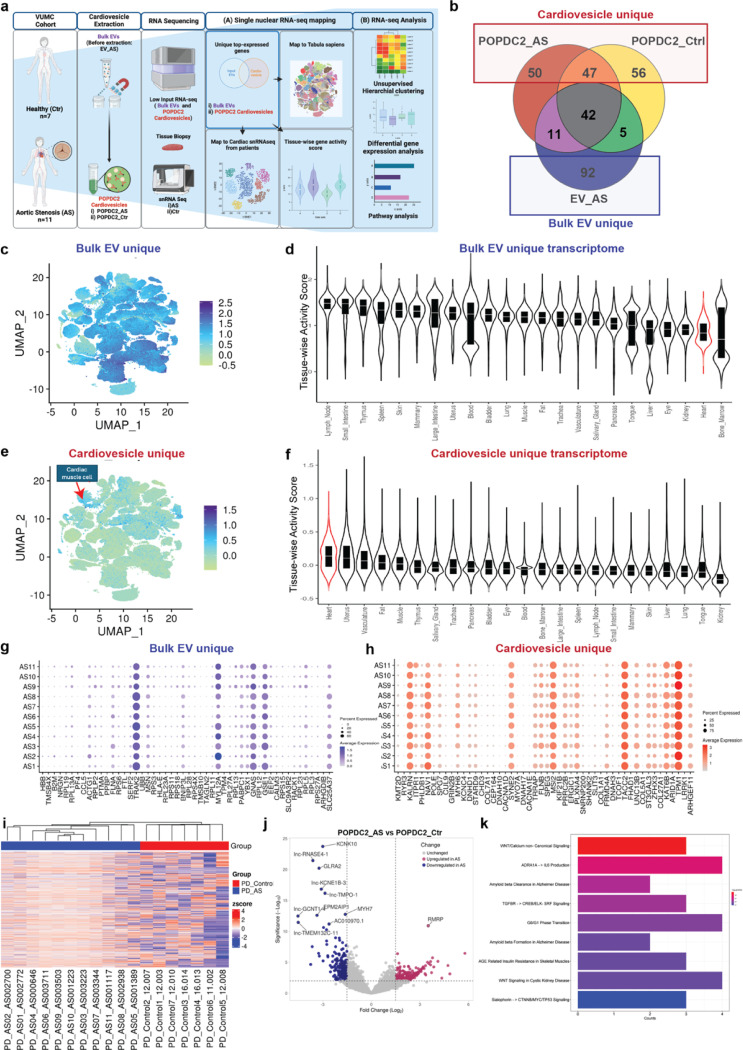
Figure 6. Molecular profiling of cardiovesicles from patients with aortic stenosis reveals enrichment of transcripts expressed in cardiomyocytes and relevant pathways in myocardial remodeling.
a. Schematic overview detailing the isolation and transcriptomic analysis of cardiovesicles from the AS cardiovascular cohort (718 samples), including Bulk EVs (unprocessed EVs, no cardiovesicle extraction) from AS patients (EV_AS, n=11) and POPDC2+ cardiovesicles from AS patients (POPDC2_AS, n=11) and controls (POPDC2_Ctr, n=7). Analysis of the top abundant transcripts, prioritized by mean expression, of EV_AS, POPDC2_AS, and POPDC2_Ctr, was conducted to identify genes unique to EV_AS (labeled as ‘Bulk EV_unique’) and those unique to POPDC2+ cardiovesicles (POPDC2_AS and POPDC2_Ctr; labeled as Cardiovesicle_unique). These were mapped onto single nuclear RNA-seq datasets and differential expression analysis was performed to identify and validate targets significantly dysregulated in AS compared to Control. b. Venn diagram analysis of the top 150 abundant transcripts (prioritized by mean expression) of EV_AS, POPDC2_AS, and POPDC2_Ctr showing Bulk EV_unique and Cardiovesicle_unique transcripts. Distribution of Bulk EV_Unique and (c) and cardiovesicle_unique transcripts (e) represented as UMAPs of the multiorgan single cell transcriptomic atlas dataset (Tabula Sapiens), with their respective tissue-wise transcriptional activity score showing other tissues in Bulk EV_unique (d) and heart in Cardiovesicle_unique gene sets (f). Dot plots g. and h. show the expression counts of Bulk EV_unique and Cardiovesicle_unique transcripts in cardiomyocytes of each individual AS patient, respectively. i. Unsupervised hierarchical clustering illustrates the transcriptional differences between AS (POPDC2_AS) and Ctrl (POPDC2_Ctr) POPDC2+ cardiovesicles. j. Volcano plots represent differentially expressed genes between POPDC2_AS and POPDC2_Ctr k. Pathway enrichment analysis reveals the differentially expressed genes between AS and Ctr POPDC2+ cardiovesicles. log FC cutoff +1, and FDR <1% have been used as statistical significance cut-offs for the differential gene expression analysis

