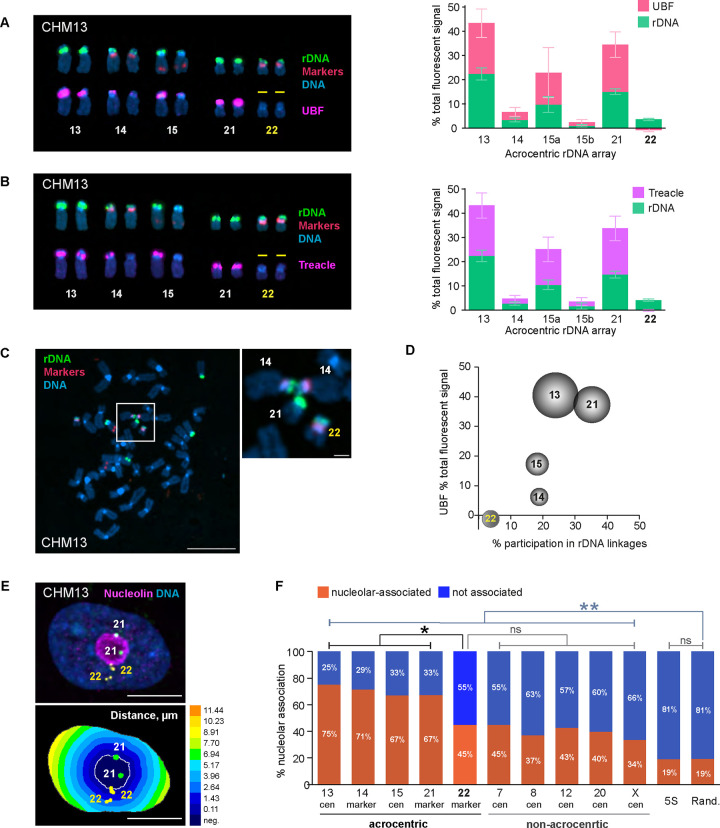
Figure 2. Effects of rDNA activity status on 3D organization in CHM13 cell line.
A. Right panel: acrocentric karyogram from a representative CHM13 chromosome spread labeled by immuno-FISH with rDNA probe and UBF antibody. Top row of chromosomes shows FISH labeling with rDNA probe (green) and chromosome identification markers CenSat 14/22 and PML (red). Bottom row shows corresponding chromosomes with UBF antibody labeling (magenta). DNA was counterstained with DAPI. Note that both rDNA arrays on chromosome 22 are UBF-negative. Left panel: Quantification of rDNA FISH and UBF antibody labeling on acrocentric arrays. rDNA FISH and UBF antibody signals were measured as fractions of the total fluorescent intensity in the chromosome spread. Since CHM13 cell line is homozygous diploid, both homologous acrocentric arrays were averaged except for chromosome 15. The pink and green sections of the bars represent averages of UBF and rDNA, respectively. Error bars denote standard deviation.
B. Treacle antibody was used for rDNA activity estimation in CHM13 by immuno-FISH and as in A. Note that both rDNA arrays on chromosome 22 are also Treacle-negative.
C. A representative chromosome spread from CHM13 cell line showing an example of the rDNA linkage between heterologous acrocentric chromosomes. rDNA (green) and chromosome identification markers (red) were labeled by FISH, DNA was counter-stained with DAPI. Bar, 10μm. Magnified insert shows the rDNA linkage between two copies of chromosome 14 and a copy of chromosome 21. Bar, 1μm.
D. Relationship between the frequency of rDNA linkages and the activity of rDNA arrays measured by UBF as fractions of the total fluorescent signal. The percent participation in rDNA linkages was determined as the fraction of total linkage occurrences for a particular chromosome. The dimensions of the spheres reflect sizes of rDNA arrays. Both homologous acrocentric arrays were averaged. Large and highly active rDNA arrays (chromosomes 13 and 21) formed linkages frequently, while the inactive arrays on chromosome 22 very rarely participated in linkages.
E. Top panel: immuno-FISH image of a representative CHM13 nucleus labeled with rDNA-adjacent markers for chromosome 21 (green), chromosome 22 (yellow), and nucleoar marker nucleolin (magenta). Nuclei were counter-stained with DAPI (blue). Bar, 10μm. Bottom panel: Euclidean Distance Transform (EDT) map of the same nucleus with nucleolus and near-centromeric markers segmented. The intensity scale indicates the distance to nucleolar boundary, μm.
F. Nucleolar association of rDNA-adjacent acrocentric chromosome-specific markers, non-acrocentric centromeric markers, and 5S rDNA loci in CHM13 cells. The orange and blue sections of the bars represent fractions of nucleolar-associated and not associated loci, respectively. Validation of rDNA-adjacent chromosome-specific markers is shown in Supplementary Figure 4A. The nucleolar association of chromosome 22 marker is significantly reduced compared to the active acrocentric chromosome markers and is not significantly different from non-acrocentric centromeric markers (Kolmogorov-Smirnov test). Note that nucleolar association of both acrocentric and non-acrocentric markers was significantly higher than that of 5S rDNA locus or random points in the nucleus. Distributions of distances from the nucleolar boundary for all markers are shown in Supplementary Figure 4B.

