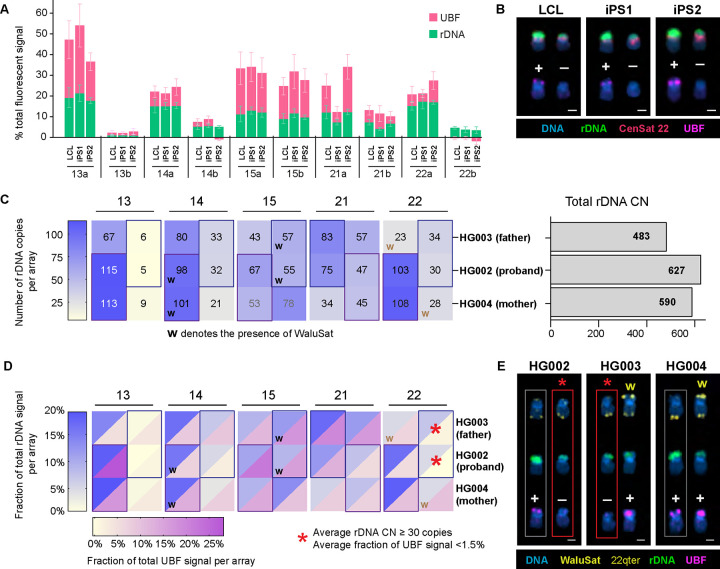
Figure 5. rDNA copy number and activity status in HG002 iPS cells and family trio.
A. Quantification of rDNA FISH and UBF antibody labeling on acrocentric arrays in HG002 LCL and two iPS cell lines. The rDNA FISH and UBF antibody signals were measured as fractions of the total fluorescent intensity in the chromosome spread. Note the smaller rDNA array on chromosome 22 that is UBF-negative in all three cell lines. The green and pink sections of the bars represent the averages of rDNA and UBF signals, respectively. Error bars denote standard deviations.
B. Examples of chromosome 22 pairs from HG002 cell lines measured in panel A. The top rows display FISH labeling with the rDNA probe (green) and CenSat 22 (red). The bottom rows show corresponding chromosomes with UBF antibody labeling (magenta). DNA was counterstained with DAPI. UBF status is indicated by +/−. Extended karyograms are provided in Supplementary Figure 7A.
C. Heatmap of rDNA copy numbers for each acrocentric rDNA array in the HG002 family trio. The proband’s arrays are sorted by size (large and small), while parental arrays are arranged to match the proband. Boxes indicate approximations for inherited arrays, and “w” denotes the presence of WaluSat. Numbers represent averages from 10 or more spreads, with detailed boxplots in Supplementary Figure 1 for HG002, and Supplementary Figure 6B for HG003 and HG004. The bar plot on the right estimates the total rDNA copy number in corresponding samples.
D. Combined heatmap of average rDNA and UBF fluorescent intensities, expressed as fractions of the total signal in a chromosome spread. Both values are averages from 10 or more spreads, with detailed bar graphs provided in Supplementary Figure 2 for HG002, and Supplementary Figure 7C for HG003 and HG004. The blue heat scale corresponds to rDNA, and the magenta heat scale corresponds to UBF. The asterisk denotes the low activity rDNA array present on the WaluSat-negative copy of chromosome 22 in HG002 (proband) and HG003 (father).
E. Examples of chromosome 22 pairs from HG002, HG003, and HG004 LCL cell lines shown in panel D. The top rows display chromosomes labeled by FISH with WaluSat probe (highlighted by arrows) and a chromosome 22 q-terminal region probe (arrow) serving as an identification marker. The middle rows show corresponding chromosomes labeled with the rDNA probe (green). The bottom rows display the corresponding chromosomes labeled with UBF antibody (magenta). DNA was counterstained with DAPI. The UBF-negative rDNA array on the WaluSat-negative copy of chromosome 22 in HG002 and the corresponding paternal copy of chromosome 22 in HG003 are highlighted by red boxes and asterisks. The maternal copy of chromosome 22 is highlighted by gray boxes. Extended acrocentric karyograms are shown in Supplementary Figure 7D.

