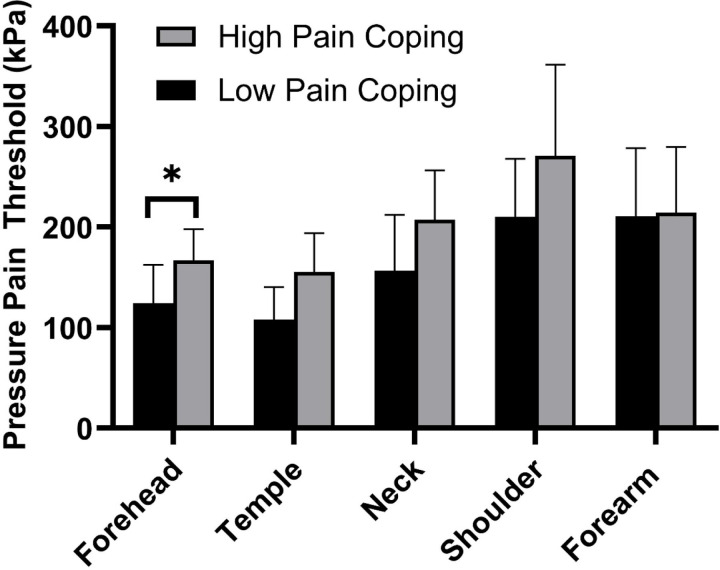
Figure 3. Comparison of Mechanical Pain Sensitivity for Persistent Post-Traumatic Headache Phenotypes.
Bars show median (IQR) for pressure pain threshold (PPT) assessed at four local test sites in the craniocervical region and one remote test site at the forearm in High Pain Coping (gray bars, N=13) and Low Pain Coping (black bars, N=20) subgroups. There was a trend for lower PPT (i.e., higher pain sensitivity) in the group with low pain coping at all craniocervical test sites, with a significant difference between groups at the forehead (*p<0.05).

