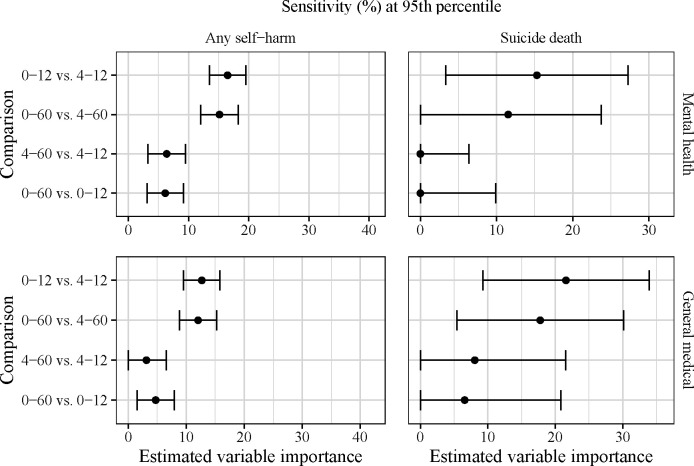
Figure 3:
Estimated variable importance for temporal predictor groups in terms of sensitivity at the 95th percentile of risk scores. Note the different x-axis scales for each outcome-setting pair, which are based on the estimated maximum possible variable importance (see Supplementary Material for details).

