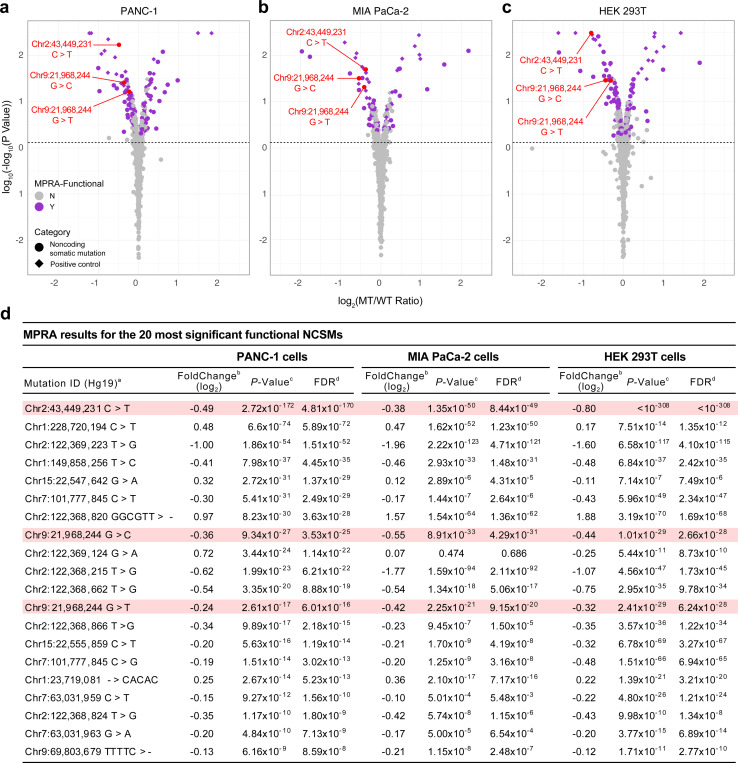
Fig. 2. MPRA results for mutations enriched in accessible chromatin regions (ACRs) and histone modification marks (HMM) mapped in pancreatic cell lines and purified pancreatic acinar and duct cell populations.
a-c, Volcano plots with MPRA results for PANC-1 (left), MIA PaCa-2 (center), and HEK293T (right) cells. MPRA effect sizes (Log2(MT RNA/DNA TPM)/(WT RNA/DNA TPM)) analyzed for the forward and reverse orientation inserts combined and significance (log10(-log10(P-value)) are show for all tested mutations. MPRA-functional mutations are shown as purple filled circles and all other mutations with grey filled circles on the plots in panels a, b and c. Mutations that were validated using individual luciferase assays are listed in red text with chromosomal location followed by the wild type and mutant alleles. d, MPRA results are listed for the 20 most significant NCSMs in PANC-1 cells, with corresponding results shown for MIA PaCa-2 and HEK293T cells. The three MPRA-functional mutations validated by individual luciferase assays are shown in pink highlights. MPRA regression results for all tested mutations and control variants are shown in Supplementary Table 10. Coordinates are based on human reference build hg19. MT: mutant allele, WT: wild type allele.

