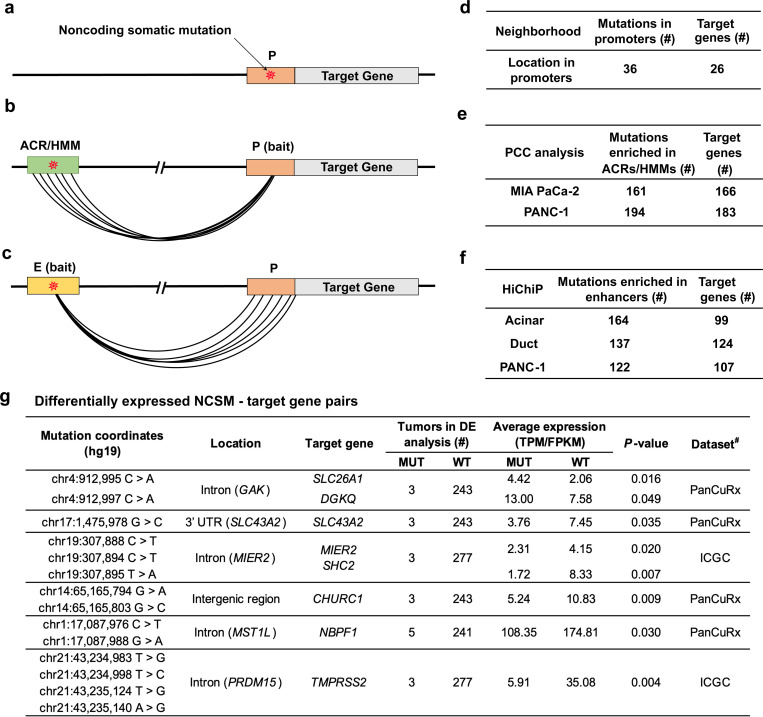
Fig. 5. Identification of potential target genes for the 988 mutations enriched in pancreatic ACRs/HMMs.
Schematic illustrations showing mutations falling: (a) directly within a promoter region, (b), in an ACR/HMM that physically interacts with a promoter region of a target gene (using chromatin interaction data detected by PCC in MIA PaCa-2 and PANC-1 cell lines), and, (c) in an enhancer region that physically interacts with a promoter region of a target gene (using chromatin interactions defined by H3K27ac HiChiP-seq in pancreatic acinar cell populations, pancreatic duct cell populations, and PANC-1 cells). d, Number of mutations enriched in promoters and their corresponding target genes. e, Number of mutations enriched in ACRs/HMMs and their target genes inferred by PCC. f, Number of mutations enriched in ACRs/HMMs, and their target genes inferred by H3K27ac HiChIP-seq. g, Differential expression analysis for PDAC samples with mutations as compared to nonmutated samples. This analysis was done separately for tumors from ICGC (n = 280) and PanCuRx (n = 246) with RNA-seq data. Significantly (Permutation test P-value ≤ 0.05) differentially expressed NCSMs - target genes. MUT: tumors with specific mutations. WT: tumors without the specific mutations. *Number of MUT and WT samples in the whole WGS dataset of 506 PDAC tumors. #Dataset with significant differential findings (results from both ICGC and PanCuRx RNA-seq datasets for these genes is shown in Supplementary Table 16).

