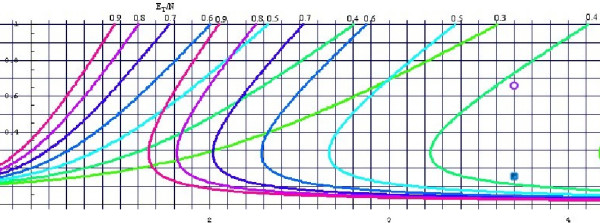
Figure 3.

The 0.05 level curves for the relative difference between the risk difference before and after the re-randomization. We assume that c = 0.40 in this figure. The horizontal axis represents d – the multiplier for the probability of reoccurrence of the event after the re-randomization; The vertical axis represents x – the percentage of the patients who were re-randomized; The curves represent 0.05 relative error level curves for different values of the ratio  of the total events reported and the initial number of patients entering the trial. The values of the ratio
  are indicated at the top of the graph. For a chosen value of the ratio
  : if a point (d, x) is between the two level curves with identical value (and color) – the relative error of the risk differences is less than 5%; otherwise – the relative error of the risk differences is more than 5%.
