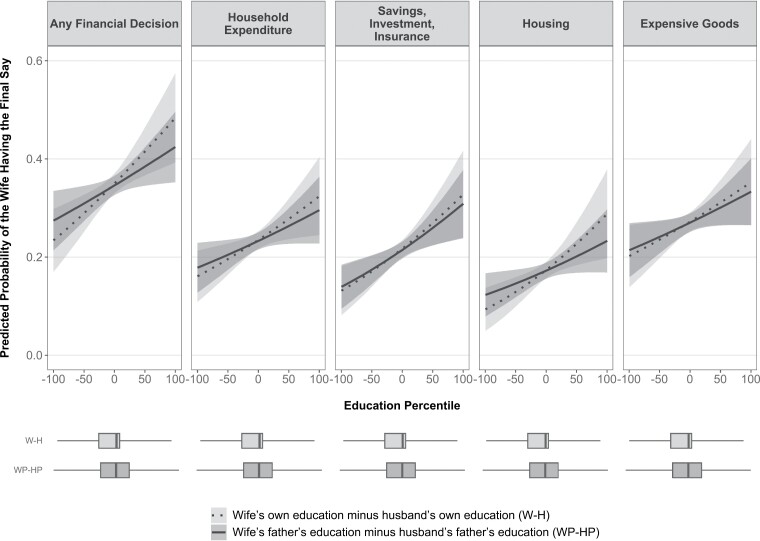
Figure 1.
Predicted probability of the wife having the final say on financial decisions by the difference between the wife’s and the husband’s parental education and the difference between the wife’s and the husband’s own education (N = 2,369) Note: Predicted probabilities were derived from Models 3a to 3e in Table 4. Solid lines plot the predicted probabilities by the difference between the education of the wife’s and the husband’s fathers when all other covariates are at their observed values. Darker grey shaded areas plot the 95-per cent confidence intervals of these probabilities. Dotted lines plot the predicted probabilities by the difference between the wife’s and the husband’s education when all other covariates are at their observed values. Lighter grey shaded areas plot the 95-per cent confidence intervals of these probabilities. The boxplots show the minimum, lower quartile, median, upper quartile, and maximum of relative spousal education and those of relative parental education, respectively. Numbers were weighted by survey sampling weights to adjust for sampling design and combined across 50 imputations. Source: China Family Panel Studies (CFPS) 2014.

