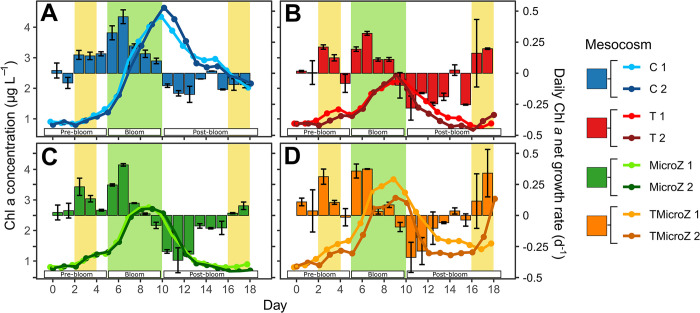
Fig 2. Chl a concentrations and daily Chl a net growth rates (r) mean (±range of the observations) in the different treatments.
Lines and dots represent Chl a concentrations. Bars represent the daily Chl a net growth rates: (A) control (C) treatment, (B) heated +3°C (T) treatment, (C) the mesozooplankton exclusion treatment (MicroZ treatment), and (D) the heated +3°C and mesozooplankton exclusion treatment (TMicroZ). Green background indicates the main bloom period common to all treatments and yellow background indicates the early and late blooms identified in T and TMicroZ treatments. Pre-bloom, bloom, and post-bloom periods, separated by dotted lines, are the periods common in all treatments used for statistical analysis.

