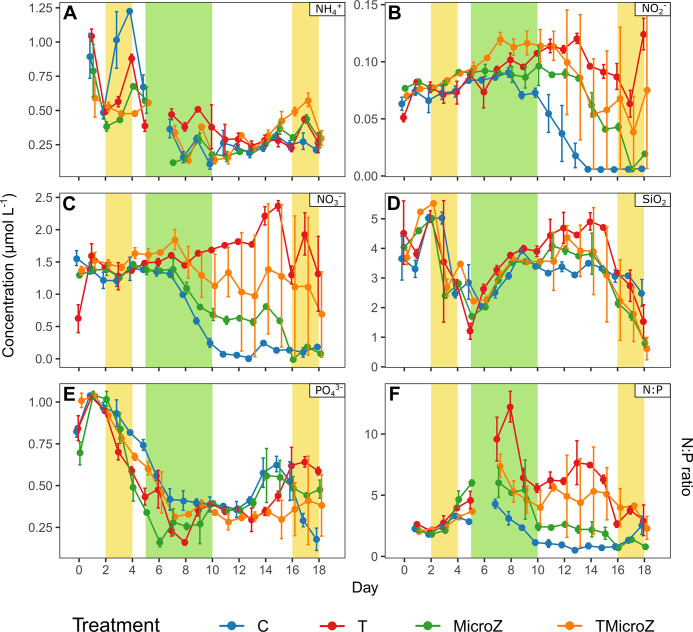
Fig 3. The daily mean (±range of the observations) of nutrient concentrations in the different treatments over the course of the experiment.
(A) NH4+, (B) NO2-, (C) NO3-, (D) SiO2, (E) PO43-, and (F) N:P ratio (with N = NH4+ + NO2- + NO3-). C, control; T, water heated +3°C; MicroZ, mesozooplankton exclusion; TMicroZ, water heated at +3°C with mesozooplankton exclusion. Green background indicates the main bloom period common to all treatments and yellow background indicates the early and late blooms identified in T and TMicroZ treatments.

