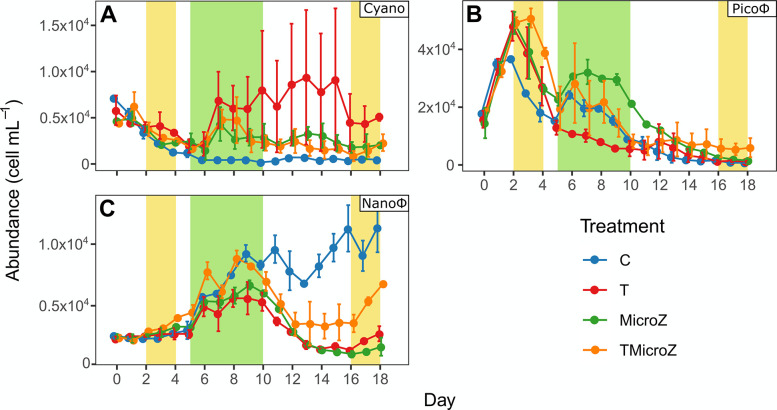
Fig 5. Mean phytoplankton abundances (±range of the observations) in the different treatments.
(A) Cyanobacteria (Cyano), (B) Picophytoeukaryotes (Picoφ), and (C) Nanophytoeukaryotes (Nanoφ). C, control; T, water heated +3°C treatment; MicroZ, mesozooplankton exclusion treatment; TMicroZ, water heated +3°C and mesozooplankton exclusion treatment. Green background indicates the main bloom period common to all treatments and yellow background indicates the early and late blooms identified in T and TMicroZ treatments.

