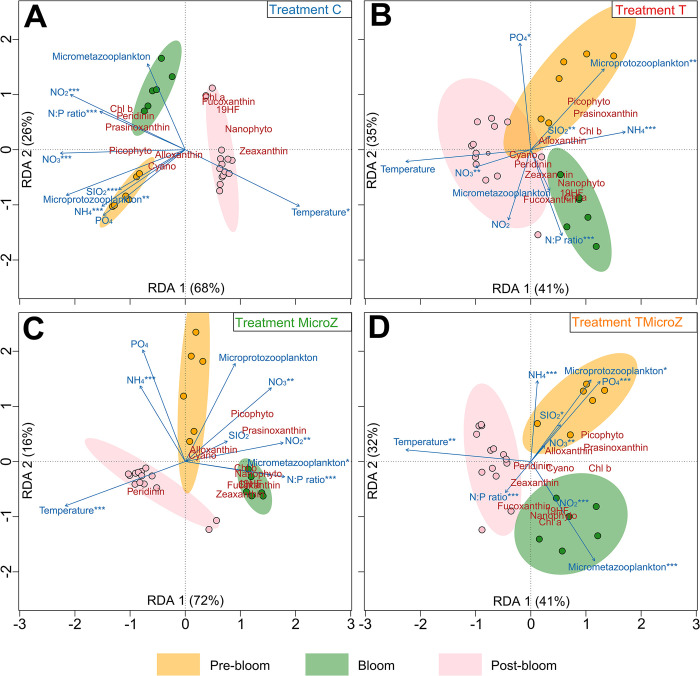
Fig 7. Redundancy Analysis (RDA) between phytoplankton composition (pigment and cytometry) and environmental parameters.
(A) control (C) treatment, (B) heated +3°C (T) treatment, (C) the mesozooplankton exclusion treatment (MicroZ treatment), and (D) the heated +3°C and mesozooplankton exclusion treatment (TMicroZ). Dots present sampling dates community composition. Blue arrows present the projections of environmental parameters. Ellipses represents 95% confidence distribution interval of community for different periods (Pre-bloom, Bloom and Post-bloom). Significance level of ANOVA: * = p-value < 0.05; ** = p-value < 0.01; *** = p-value < 0.001. Red labels present projection of the pigments and cytometry groups. The proximity between environmental parameters or pigments and cytometry groups and sampling dates indicates characteristic associations.

