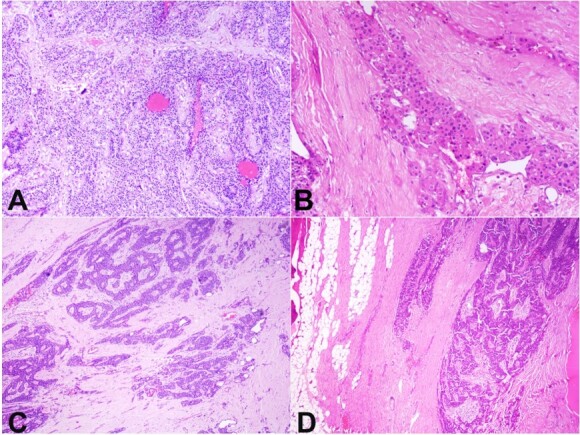
Figure 4. Photomicrographs of the tumor. A – Monomorphic tumor cells arranged in cords, trabeculae, and organoid pattern (H&E, 100x), B – Focal oncocytic changes in tumor cells (right side, H&E, 400x); C – Expanded and fibrotic capsule with extensive capsular infiltration by tumor cells (H&E, 100x); D – Tumor limited to capsule without any extracapsular spread (H&E, 100x).

