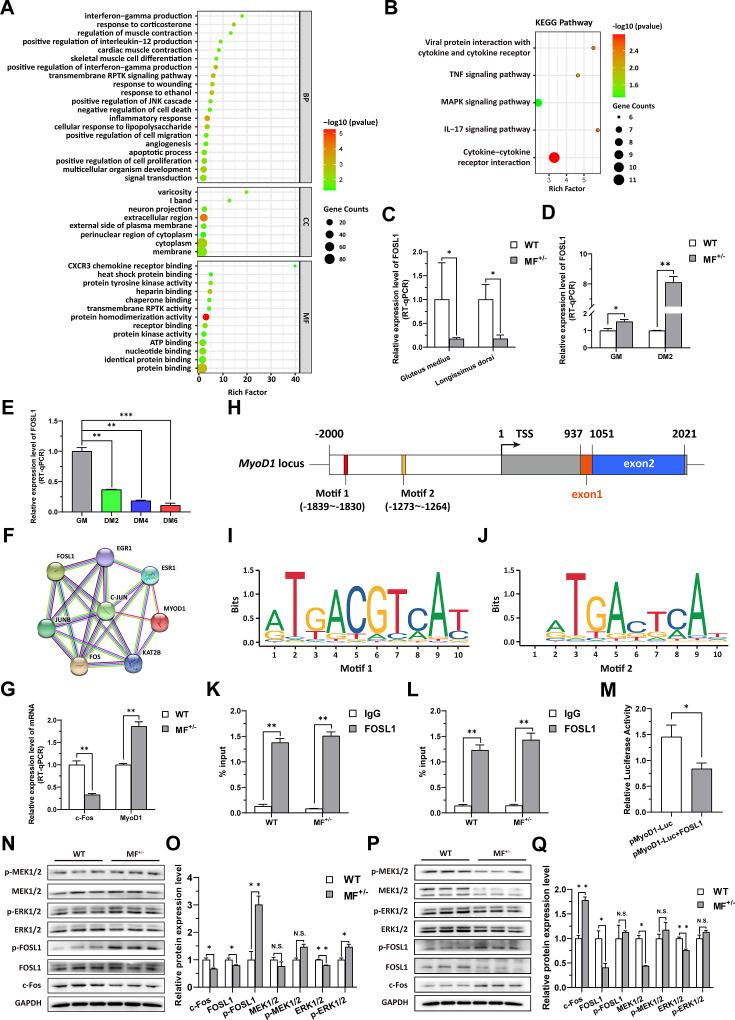
Figure 4. The MSTNDel73C mutation with FGF5 knockout contributes to muscle phenotype via MEK-ERK-FOSL1 axis.
(A) Go enrichment analysis of DEGs. Among them, the top 20 entries with significant enrichment are listed in biological process (BP). CC, cellular component; MF, molecular function. (B) KEGG enrichment analysis of DEGs. (C) The mRNA expression level of FOSL1 both at gluteus medius and longissimus dorsi in WT (n=3) and MF+/- (n=4) sheep. (D) The mRNA expression level of FOSL1 both at GM and DM2 in WT and MF+/- cells (n=3). (E) The expression level of FOSL1 mRNA during myogenic differentiation (n=3). (F) The protein-protein interaction (PPI) analysis of FOSL1, c-Fos and MyoD1. (G) The mRNA expression level of c-Fos and MyoD1 at GM in WT and MF+/- myoblasts (n=3). (H) Schematic diagram of MyoD1 gene body, promoter region and binding sites. (I–J) FOSL1 recognition motif in the MyoD1 promoter region. (K) FOSL1 ChIP-qPCR of motif 1 recognition region (n=3). (L) FOSL1 ChIP-qPCR of motif 2 recognition region (n=3). (M) Dual luciferase assay for the effect of FOSL1 on MyoD1 promoter activity (n=4). (N) Western blot of FOSL1, c-Fos, and key kinases of MAPK signaling pathways at GM. (O) Quantification of protein expression of FOSL1, c-Fos, and key kinases of MAPK signaling pathways at GM (n=3). (P) Western blot of FOSL1, c-Fos, and key kinases of MAPK signaling pathways at DM2. (Q) Quantification of protein expression of FOSL1, c-Fos, and key kinases of MAPK signaling pathways at DM2 (n=3). Data: mean ± SEM. Unpaired student’s t-test was used for statistical analysis. All student’s t-test were performed after the equal variance test, otherwise the t-test with Welch’s correction were used. *p<0.05, **p<0.01, and ***p<0.001.


