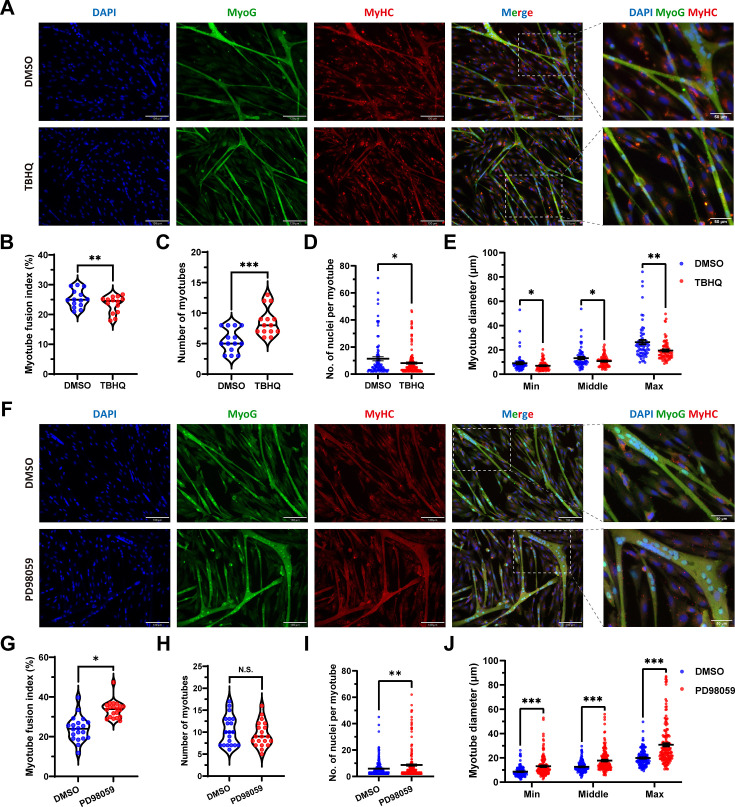
Figure 7. FOSL1 activity is a key regulator of myogenic differentiation and muscle myofiber hyperplasia.
(A) Immunofluorescence staining of myogenic differentiation markers MyoG and MyHC in sheep skeletal muscle satellite cells at DM2 after addition of 20 μM TBHQ. Scale bar 130 μm or 50 μm. (B–E) The myotube fusion index, number of myotubes, number of nuclei per myotube and the myotube diameter at DM2 after addition of 20 μM TBHQ (n=3). All data points were shown. (F) Immunofluorescence staining of myogenic differentiation markers MyoG and MyHC in sheep skeletal muscle satellite cells at DM2 after addition of 1 μM PD98059. Scale bar 130 μm or 50 μm. (G–J) The myotube fusion index, number of myotubes, number of nuclei per myotube and the myotube diameter at DM2 after addition of 1 μM PD98059 (n=3). All data points were shown. Data: mean ± SEM. Unpaired student’s t-test and chi square test were used for statistical analysis. All student’s t-test were performed after the equal variance test, otherwise the t-test with Welch’s correction were used. *p<0.05, **p<0.01, and ***p<0.001.

