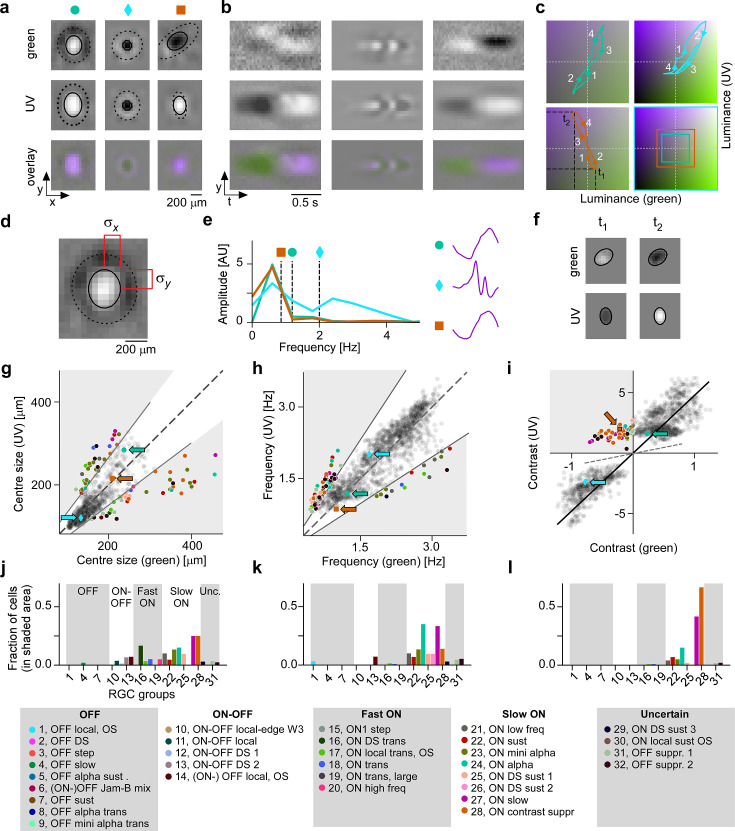
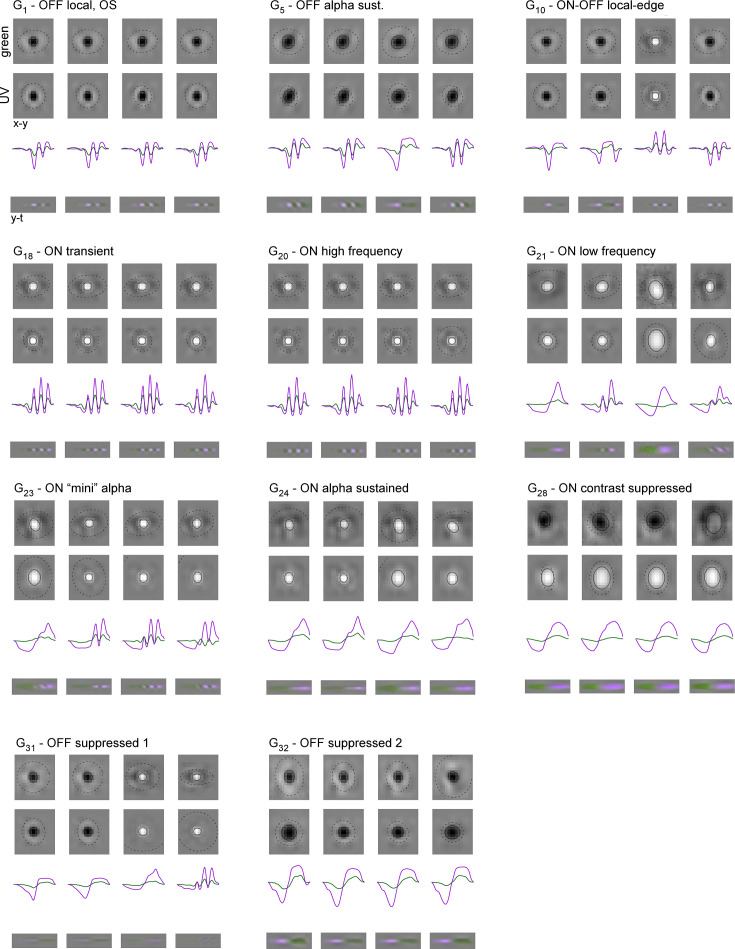
Figure 3. Spatial, temporal, and chromatic properties of maximally exciting inputs (MEIs) differ between retinal ganglion cell (RGC) groups.
(a) Spatial component of three example MEIs for green (top), UV (middle), and overlay (bottom). Solid and dashed circles indicate MEI centre and surround fit, respectively. For display, spatial components in the two channels were re-scaled to a similar range and displayed on a common grey-scale map ranging from black for to white for , i.e., symmetric about 0 (grey). (b) Spatiotemporal (y–t) plot for the three example MEIs (from (a)) at a central vertical slice for green (top), UV (middle), and overlay (bottom). Grey-scale map analogous to (a). (c) Trajectories through colour space over time for the centre of the three MEIs. Trajectories start at the origin (grey level); direction of progress indicated by arrow heads. Bottom right: Bounding boxes of the respective trajectory plots. (d) Calculation of MEI centre size, defined as +, with and the s.d. in horizontal and vertical direction, respectively, of the difference-of-Gaussians (DoG) fit to the MEI. (e) Calculation of MEI temporal frequency: Temporal components are transformed using fast Fourier transform, and MEI frequency is defined as the amplitude-weighted average frequency of the Fourier-transformed temporal component. (f) Calculation of centre contrast, which is defined as the difference in intensity at the last two peaks (indicated by and , respectively, in (c)). For the example cell (orange markers and lines), green intensity decreases, resulting in OFF contrast, and UV intensity increases, resulting in ON contrast. (g) Distribution of green and UV MEI centre sizes across N=1613 cells (example MEIs from (a–c) indicated by arrows; symbols as shown on top of (a)). 95% of MEIs were within an angle of ±8° of the diagonal (solid and dashed lines); MEIs outside of this range are coloured by cell type. (h) As (g) but for distribution of green and UV MEI temporal frequency. 95% of MEIs were within an angle of ±11.4° of the diagonal (solid and dashed lines). (i) As (g) but for distribution of green and UV MEI centre contrast. MEI contrast is shifted away from the diagonal (dashed line) towards UV by an angle of 33.2° due to the dominance of UV-sensitive S-opsin in the ventral retina. MEIs at an angle >45° occupy the upper left, colour-opponent (UVON-greenOFF) quadrant. (j, k) Fraction of MEIs per cell type that lie outside the angle about the diagonal containing 95% of MEIs for centre size and temporal frequency. Broad RGC response types indicated as in Baden et al., 2016. (l) Fraction of MEIs per cell type in the upper-left, colour-opponent quadrant for contrast.


