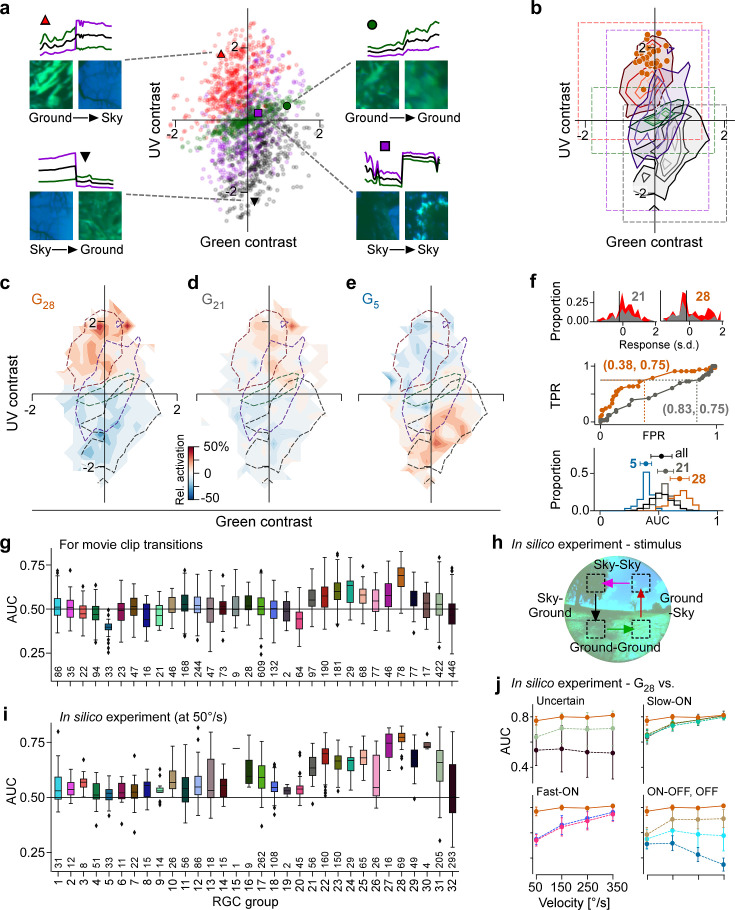
Figure 7. Chromatic contrast tuning allows detection of ground-to-sky transitions.
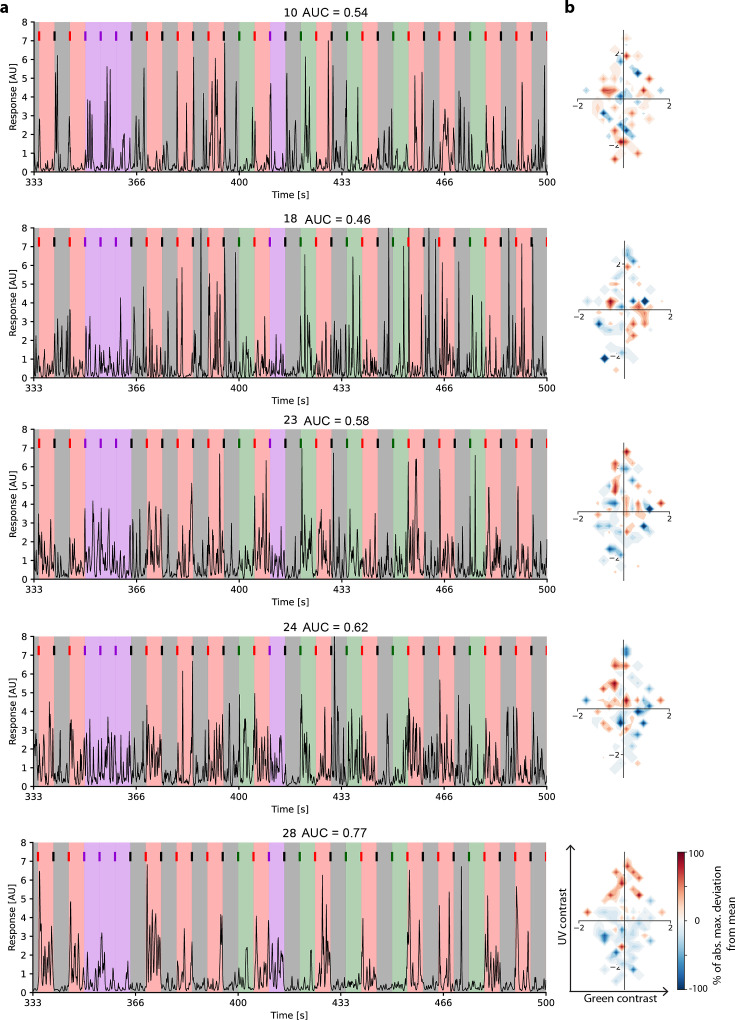
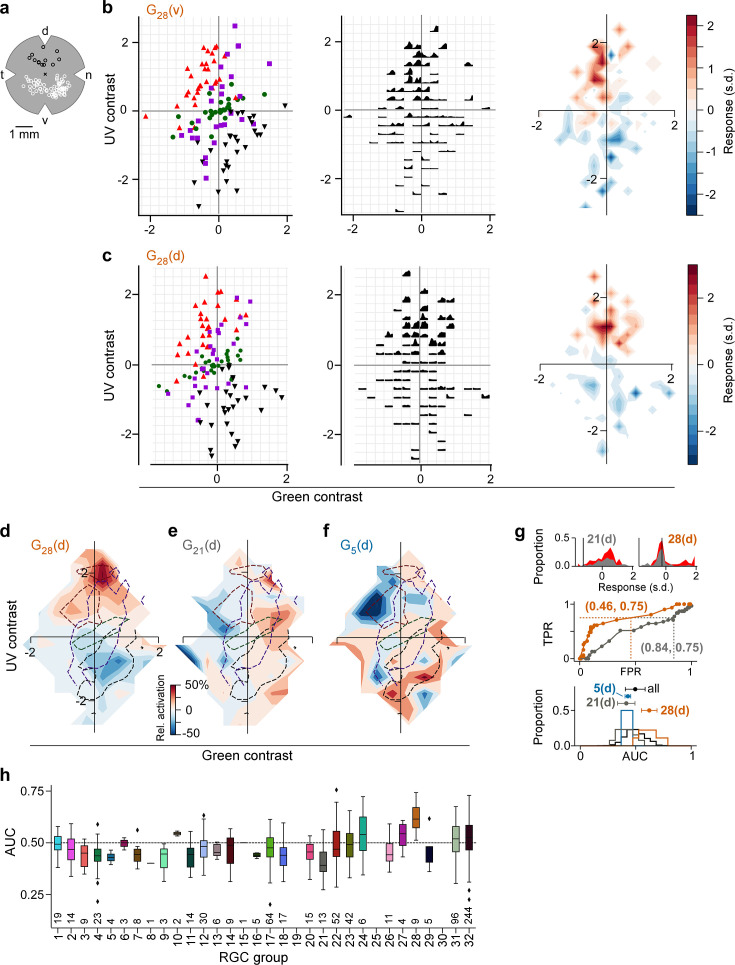
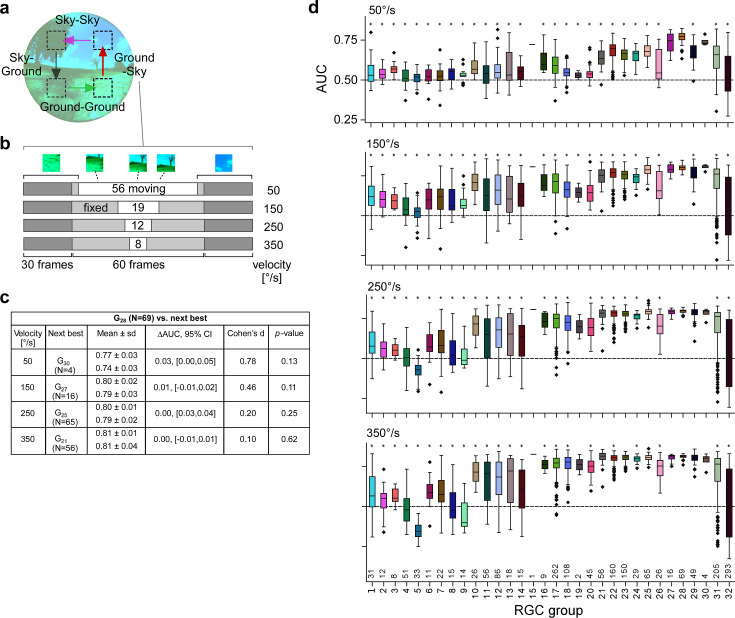
(a) Distribution of green and UV contrasts of all movie inter-clip transitions (centre), separately for the four transition types, for each of which an example is shown: ground-to-sky (N=525, top left, red triangle), ground-to-ground (N=494, top right, green disk), sky-to-ground (N=480, bottom left, black downward triangle), and sky-to-sky (N=499, bottom right, purple square). Images show last and first frame of pre- and post-transition clip, respectively. Traces show mean full-field luminance of green and UV channels in last and first 1 s of pre- and post-transition clip. Black trace shows luminance averaged across colour channels. (b) Distributions as in (a), but shown as contours indicating isodensity lines of inter-clip transitions in chromatic contrast space. Density of inter-clip transitions was estimated separately for each type of transition from histograms within 10 × 10 bins that were equally spaced within the coloured boxes. Four levels of isodensity for each transition type shown, with density levels at 20% (outermost contour, strongest saturation), 40%, 60%, and 80% (innermost contour, weakest saturation) of the maximum density observed per transition: 28 sky-to-ground (black), 75 ground-to-ground (green), 42 sky-to-sky (purple), and 45 ground-to-sky (red) transitions per bin. Orange markers indicate locations of N=36 G28 maximally exciting inputs (MEIs) in chromatic contrast space (Figure 3i). (c) Tuning map of G28 retinal ganglion cells (RGCs) (N=78), created by averaging the tuning maps of the individual RGCs, overlaid with outermost contour lines from (b) (Figure 7—figure supplement 2). (d, e) Same as (c) for G21 ((g), N=97) and G5 ((h), N=33). (f) Top: Illustration of receiver operating characteristic (ROC) analysis for two RGCs, a G21 (left) and a G28 (right). For each RGC, responses to all inter-clip transitions were binned, separately for ground-to-sky (red) and all other transitions (grey). Middle: Sliding a threshold across the response range, classifying all transitions with response as ground-to-sky, and registering the false-positive rate (FPR) and true-positive rate (TPR) for each threshold yields an ROC curve. Numbers in brackets indicate (FPR, TPR) at the threshold indicated by vertical line in histograms. Bottom: Performance for each cell, quantified as area under the ROC curve (AUC), plotted as distribution across AUC values for all cells (black), G21 (grey), G5 (blue), and G28 (orange); AUC mean ± SD indicated as dots and horizontal lines above histograms. (g) Boxplot of AUC distributions per cell type. Boxes extend from first quartile () to third quartile () of the data; line within a box indicates median, whiskers extend to the most extreme points still within [, ], IQR = inter-quartile range. Diamonds indicate points outside this range. All plot elements (upper and lower boundaries of the box, median line, whiskers, diamonds) correspond to actual observations in the data. Numbers of RGCs for each type are indicated in the plot. (h) Illustration of stimulus with transitions with (Sky-Ground, Ground-Sky) and without (Sky-Sky, Ground-Ground) context change at different velocities (50, 150, 250, and 350 °/s) used in in silico experiments in (i, j). (i) Like (g) but for model cells and stimuli illustrated in (h) at 50/s (see (h)). (j) AUC as function of transition velocity for G28 (orange) vs. example RGC groups (‘Uncertain', G31,32; Slow-ON, G21,23,24; Fast-ON, G18,20; ON-OFF, G10; OFF, G1,5).


