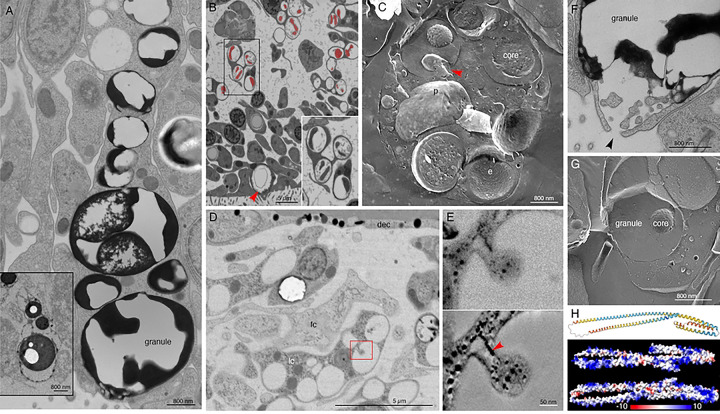
Fig 3. Ultrastructural features of lipophil cells and the structure of a highly expressed lipophil cell secretory protein.
(A) Transmission electron microscopy (TEM) image of a thin section from a lipophil cell (LC) with osmiophilic material in its granules. The inset shows a TEM image of a section from an animal fixed with osmium, which better preserved the lipidic content of the granules and their cores. (B) SEM image of a section taken in a backscatter mode shows that granules in basal portions of LC have a dense core (artificially colored red) surrounded by electron lucent content. Inset is an enlarged view of the boxed region. Arrowhead indicates an apical LC granule. (C) Freeze fracture replica showing a basal part of a LC with multiple granules. Note dual component nature of the granules. A fracture through the interior of a core reveals heterogeneous content resembling cytoplasm. Arrowhead marks a protrusion emanating inward from the granule wall. (D) TEM image of 100 nm thick section showing basal region of a LC as inferred from its proximity to the dorsal side of the animal. Red box depicts a region with a protrusion inside a granule, further studied by EM tomography in (E). (E) Upper panel is an EM projection showing direct connection between the protrusion and the inner surface of the granule. Lower panel is a 1.75 nm thick virtual slice through a reconstructed volume of the tomogram. Note that ER (arrowhead) penetrates the protrusion. (F) TEM image of an apical part of an LC showing exocytosis (arrowhead) of a large granule. Note osmiophilic material and membranous particles located near the site of exocytosis. (G) Freeze fracture replica showing an apical part of a LC and its apical granule. (H) A protein present exclusively in LC secretome is largely composed of alpha helices (AlphaFold per-residue confidence score, pLDDT, color-coded: dark blue > 90 very high confidence; light blue 90 > pLDDT > 70 confident; yellow 70 > pLDDT > 50 low confidence; and orange < 50 very low confidence) and is positively charged (electrostatic map created with ChimeraX). dec – dorsal epithelial cell; e – e-face; fc – fiber cell; lc – lipophil cell; p – p-face. Scale bars 5 μm (B, D), 800 nm (A, C, F, G), and 50 nm (E).

