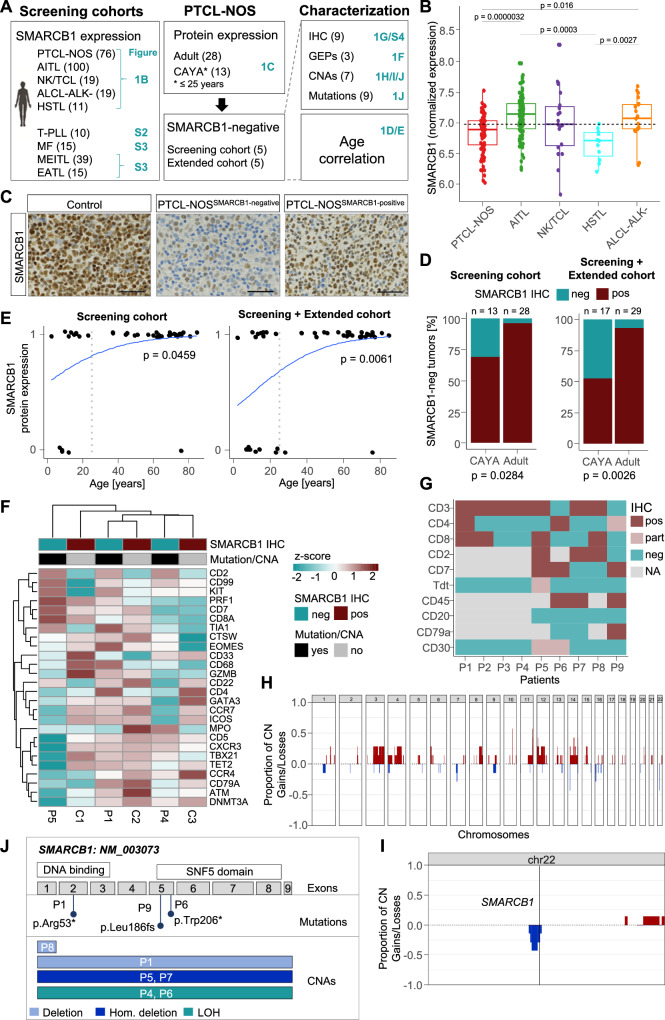
Fig. 1. Thirty-one percent of PTCL-NOS are SMARCB1-negative in pediatric and young patients.
A Overview of patient cohorts and methods for genetic characterization of patients with T-cell lymphomas and exact patient number for each cohort. B SMARCB1 RNA expression in samples from the TENOMIC study (n = 225). Normalized expression is shown. The dashed line represents the median expression value of all subgroups. Wilcoxon test (two-sided), all significant adjusted p values (Benjamini–Hochberg) are indicated. Boxplot settings: middle, median; lower hinge, 25% quantile; upper hinge, 75% quantile; upper/lower whisker, largest/smallest observation less/greater than or equal to upper/lower hinge ±1.5 × IQR. C Immunohistochemistry of SMARCB1. Exemplary images of sections from SMARCB1-positive and negative human PTCL-NOS cases compared to control tissue (tonsils). Scale bars: 50 µm. The experiment was performed for five SMARCB1-negative lymphomas. D 31% of PTCL-NOS patients under 25 years old (CAYA) (n = 4/13) and 3.6% of adults (n = 1/28) present loss of SMARCB1 protein expression. Fisher’s exact test (two-sided), *p = 0.0284. Adding the extended cohort, 47% (n = 8/17) of CAYA patients and 7% (n = 2/29) of adults were negative for SMARCB1 expression. Fisher’s exact test, *p = 0.0026. Protein expression was evaluated using IHC. E Correlation of SMARCB1 protein expression and age in PTCL-NOS patients. Protein expression was evaluated using IHC. Negative cases with no SMARCB1 expression are labeled with ‘0’ while cases with complete or partial SMARCB1 expression are labeled with 1. Data is shown for 42 patients (14 CAYA patients, 28 adults). Wald test from binomial generalized linear model (two-sided), *p value = 0.0459. Adding the extended cohort, the p value decreases to 0.0061. F Transcriptomic profiling of three SMARCB-negative PTCL-NOS patient samples (patient 1, 4, and 5) and three control SMARCB1-positive PTCL-NOS samples (C1-3). HTG transcriptome panel was used and normalized gene expression is shown for genes connected to PTCL-NOS subtypes. G Immunohistochemical characterization of nine SMARCB1-negative cases. H, I Copy number profiling of seven SMARCB1-negative cases using OncoScan. The proportion of gains and losses is shown for all autosomes (H) and chromosome 22 in detail (I). J Summary of copy number and mutational profiling in nine SMARCB1-negative cases. Source data of B, D and E are provided as a Source Data file. A Created with BioRender.com released under a Creative Commons Attribution-NonCommercial-NoDerivs 4.0 International license. PTCL-NOS Peripheral T cell lymphoma not otherwise specified, AITL Angioimmunoblastic T cell lymphoma, NKTCL Natural killer/ T cell lymphoma, HSTL Hepatosplenic T cell lymphoma, ALCL-ALK- ALK-negative anaplastic large cell lymphoma, T-PLL T-cell prolymphocytic leukemia, MF mycosis fungoides, MEITL monomorphic epitheliotropic intestinal T cell lymphoma, EATL enteropathy-associated T-cell lymphoma, CAYA children adolescents and young adults, IHC immunohistochemistry, GEPs gene expression profiles, CNAs copy number alterations, pos positive, neg negative, part partial expression, P1-9 patient 1–9, hom homozygous, LOH loss of heterozygosity.

