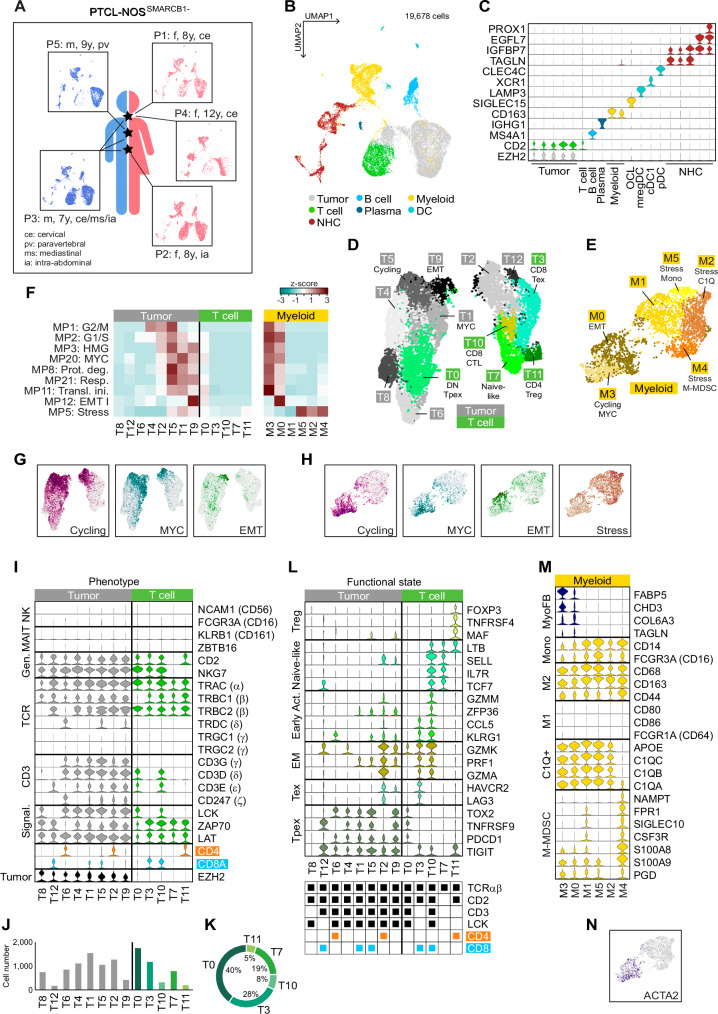
Fig. 3. Single-cell landscape of human PTCL-NOSSMARCB1-.
A Overview of the five patient samples P1-P5 with information on gender, age, and tumor location. B Uniform manifold approximation and projection (UMAP) plot of the integrated scRNA-seq dataset. C Violin plot showing expression of cell type-specific marker genes in individual clusters. OCL osteoclast, DC dendritic cell, pDC plasmacytoid DC, cDC1 conventional type 1 DC, mregDC mature DC enriched in immunoregulatory molecules, NHC non-hematopoietic cell. D UMAP plot of the Tumor/T-cell subset and (E) the Myeloid subset after re-clustering. F Heatmap showing overlaps of cluster-specific DEG sets with signatures of cancer hallmark metaprograms38. Z-scores were calculated on a row-by-row basis. G Averaged expression levels of the identified gene signatures of tumor cell clusters T5 (Cycling), T1 (MYC) and T9 (EMT), and (H) of myeloid clusters M3 (Cycling and MYC), M0 (EMT) and M2/4/5 (Stress). I Classification of tumor and T-cell clusters. NK natural killer cell, MAIT mucosal-associated invariant T-cells, Gen. generic T-cell marker, TCR T-cell receptor, Signal. TCR signaling. J Cell numbers of the individual tumor clusters (gray bars) or T-cell clusters (green bars), and K relative proportions of T-cell clusters as a circular diagram. L Different functional states of the tumor and T-cell clusters based on marker gene expression. Treg regulatory T-cell, Early Act. early activation state, EM effector memory T-cell, Tex terminally exhausted state, Tpex precursor-exhausted state. M Immunosuppressive features within the Myeloid subset. MyoFB myofibroblasts, Mono monocytes, M1/2 M1/2 polarization, M-MDSC mononuclear myeloid-derived suppressor cells. N ACTA2 expression in the Myeloid subset. Source data of J and K are provided as a Source Data file. A Created with BioRender.com released under a Creative Commons Attribution-NonCommercial-NoDerivs 4.0 International license.

