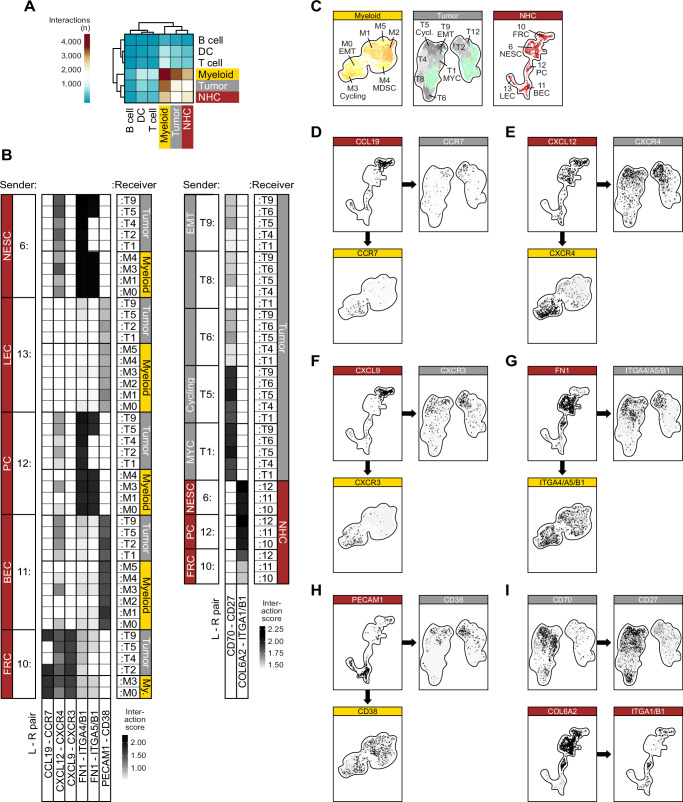
Fig. 4. Cell-cell communication in the tumor niche.
A Heatmap showing the number of significant ligand-receptor pairs for each cellular compartment. B Heatmap showing selected ligand-receptor (L-R) pairs for interactions of sender clusters (left) and receiver clusters (right). The greyscale indicates interaction score values. C Overview maps of the participating clusters within the three analyzed compartments. D–I Feature plots showing the average expression values of the displayed L-R pairs in the respective compartments.

