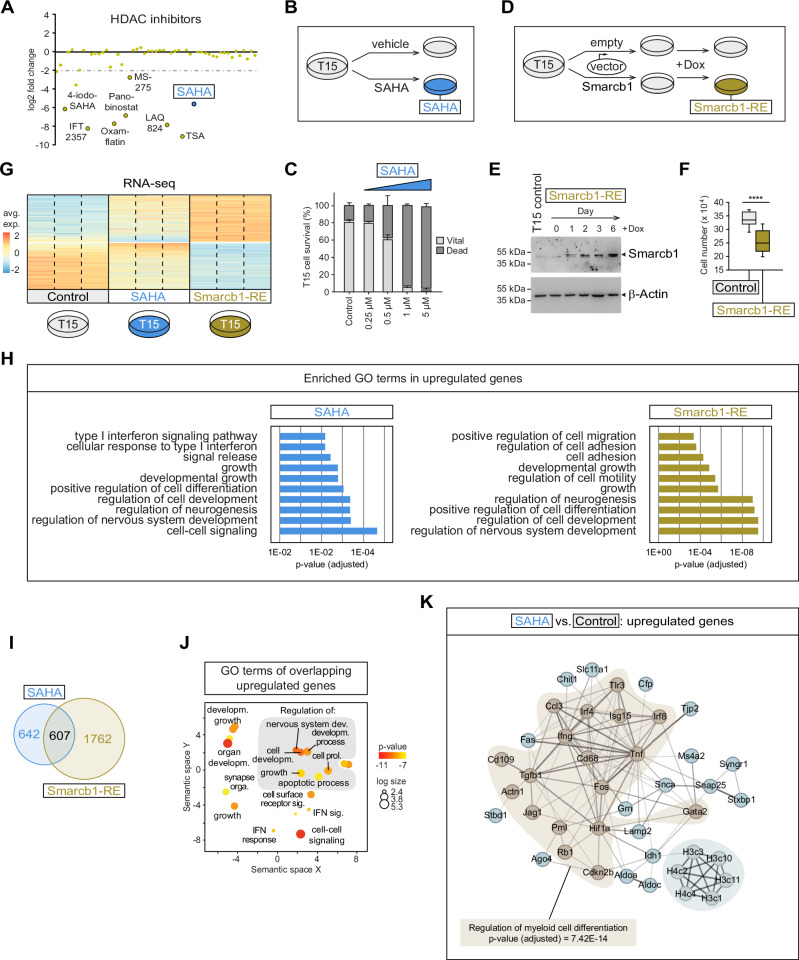
Fig. 6. SAHA treatment recapitulates Smarcb1 re-expression in PTCL-NOSSmarcb1−.
A Effect of HDAC inhibitors on the viability of T15 cells versus seven non-Hodgkin lymphoma (NHL) cell lines. Cells were treated twice with 1 µM inhibitor over the course of five days and measured using an MTT assay. T15 cell viability was set in relation to NHL cells and is shown as log2 fold change. B Scheme of SAHA treatment. C Dosage-dependent cytotoxic effects of SAHA on T15 cells (n = 4 biological replicates; data are presented as means +/– SD). D Scheme of Smarcb1 re-expression (Smarcb1-RE). T15 cells were transduced with an empty control vector or a Smarcb1 expression vector and induced by doxycycline (Dox; 0.5 μg/μl). E Representative immunoblots showing Dox-induced Smarcb1 re-expression. Beta-actin serves as a loading control. F Effect of Smarcb1 re-expression on T15 cell growth. The boxplots show median (center line), first and third quartile (bounds) and minima/maxima (whiskers) of Dox-treated (0.5 µg/µl; 72 h) T15 control and Smarcb1-RE cells (n = 3 biological replicates; paired two-sided T test; ****p = 2.17E-05). Boxplot settings: middle, median; lower hinge, 25% quantile; upper hinge, 75% quantile; upper/lower whisker, largest/smallest observation less/greater than or equal to upper/lower hinge ±1.5 × IQR. G RNA sequencing (RNA-seq) analysis of T15 control cells, SAHA-treated (1 µM, 72 h) cells or Dox-induced (0.5 µg/µl, 72 h) Smarcb1-RE cells (3 biological replicates each). The heatmap shows the averaged gene expression values (avg. exp.) of significantly up- and down-regulated genes. H ToppGene (https://toppgene.cchmc.org/) was used to determine significantly enriched gene ontology (GO) terms associated with upregulated genes in SAHA or Smarcb1-RE cells. Shown are p values adjusted for multiple testing (Benjamini–Hochberg). I Venn diagram showing the overlap of SAHA and Smarcb1-RE upregulated genes. J GO analysis of overlapping genes using REVIGO98. The dot plot shows cluster representatives based on semantic similarities, where dot color indicates ToppGene-derived p values and dot size the frequency of the GO term in the underlying database. K Functional gene network analysis using STRING, showing that SAHA treatment regulates genes involved in myeloid cell differentiation (p value adjusted for multiple testing using Benjamini–Hochberg). Source data of A, C, E, F and H–K are provided as a Source Data file.

