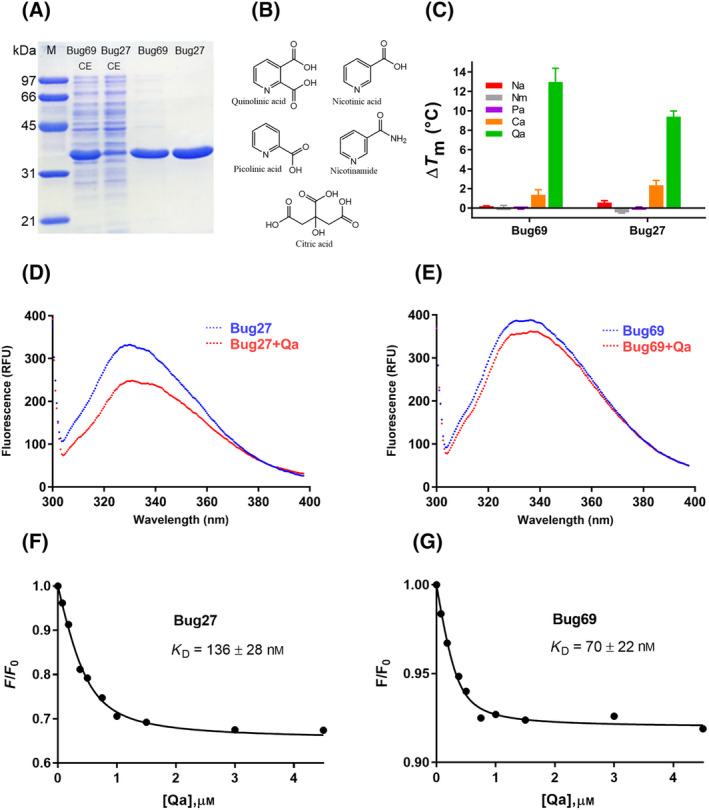
Fig. 3.

In vitro characterization of Bordetella pertussis Bug69 and Bug27. (A) SDS/PAGE of purified Bug69 and Bug27. M, protein molecular marker; CE, crude extracts (CE). (B) Chemical structures of pyridine NAD precursors and other carboxylic compounds used for the in vitro binding screening. (C) Histograms of the ΔT m (°C) of Bug69 and Bug27 in the presence of 1 mm concentration of the tested compound. The data represent the mean ± SD of three independent experiments. (D, E) Fluorescence emission spectra of Bug27 and Bug69 in the presence and absence of saturating quinolinate (4.5 μm). The excitation and emission wavelengths were 295 and 328 nm, respectively. (F, G) The amplitude of normalized fluorescence as a function of quinolinate concentration for Bug27 (left) and Bug69 (right). The solid line represents a fit to the equation provided in the methods section. Data represent the mean of three independent experiments.
