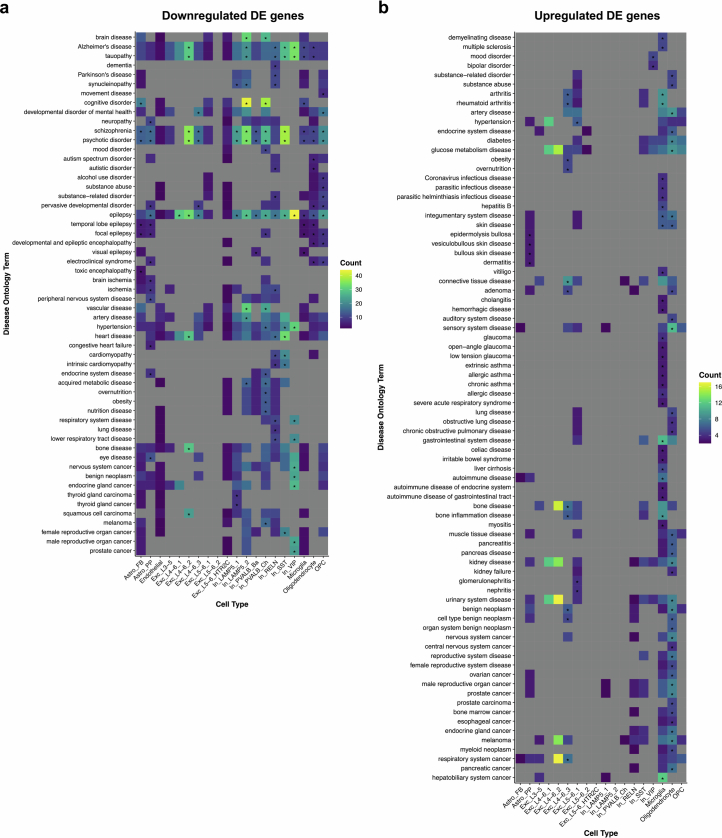
Extended Data Fig. 8. Disease enrichment of age-regulated genes.
a-b, Heatmap depicting disease enrichment of age-regulated DE genes (at FDR-adjusted p-value < 0.05) across cell types for downregulated (a) and upregulated (b) DE genes respectively. Only cell types with minimum one disease ontology (DO) term were included. Colors represent the number of genes (count) contributing to the DO term. Significance was determined using the one-sided Fisher’s exact test followed by multiple testing correction (fdr). * asterisk indicates FDR-adjusted p-value < 0.05. Grey values indicate NA.

