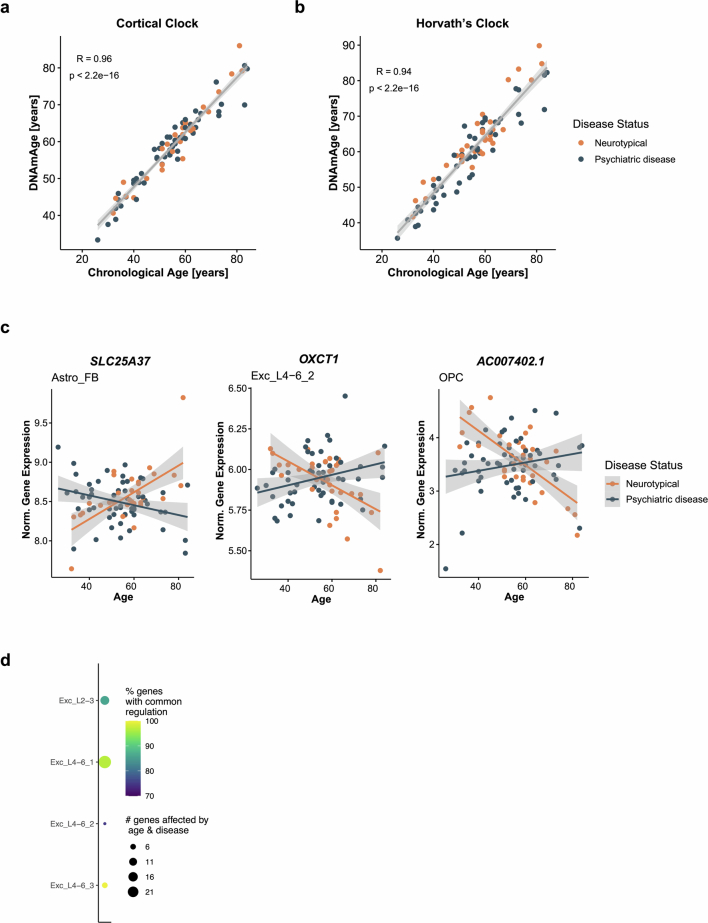
Extended Data Fig. 9. Epigenetic age, genes with interactive effects and overlap of age-regulated and disease-associated genes.
a-b, Scatterplots showing the Pearson’s correlation (R, two-sided) between chronological age (x-axis) and DNA methylation age (DNAmAge; y-axis) as estimated using the CorticalClock (a) and Horvath’s multi-tissue clock (b). c, Scatterplots showing log normalized gene expression, corrected for covariates, across aging for genes showing an interactive effect between aging and disease status; SLC25A37 in Astro_FB (left), OXCT1 in Exc_L4-6_2 (middle), and AC007402.1 in OPC (right). Error bands represent the 95% confidence interval. d, Plot depicting the number of genes associated with both age and psychiatric disease. Size of the circle is proportional to the number of overlapping genes and color indicates the percentage of genes regulated in the same (common) direction across respective cell types.

