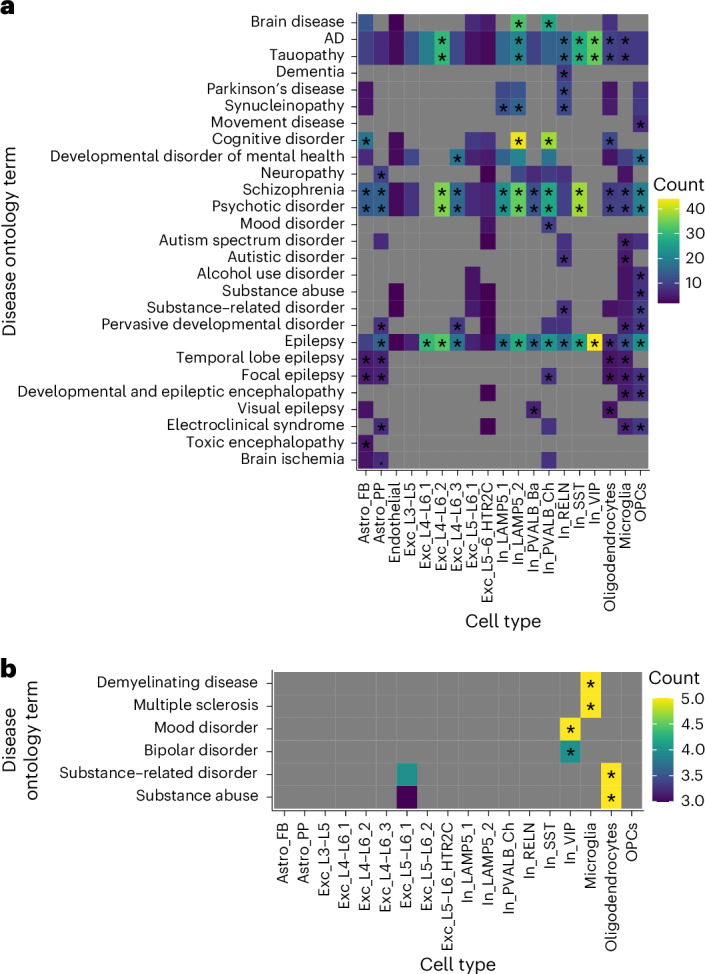
Fig. 4. Disease enrichment for brain-related diseases of age-regulated genes.

a,b, Heat maps depicting disease enrichment of age-regulated DE genes (at FDR-adjusted P < 0.05) across cell types for downregulated (a) and upregulated (b) DE genes. Only cell types with a minimum of one disease ontology term were included. Colors represent the number of genes (count) contributing to the disease ontology term. Significance was determined using a one-sided Fisher’s exact test, followed by multiple testing correction (FDR). Asterisks (*) indicate an FDR-adjusted P < 0.05. Gray values indicate not applicable. Only enrichment for brain-related diseases is shown.
