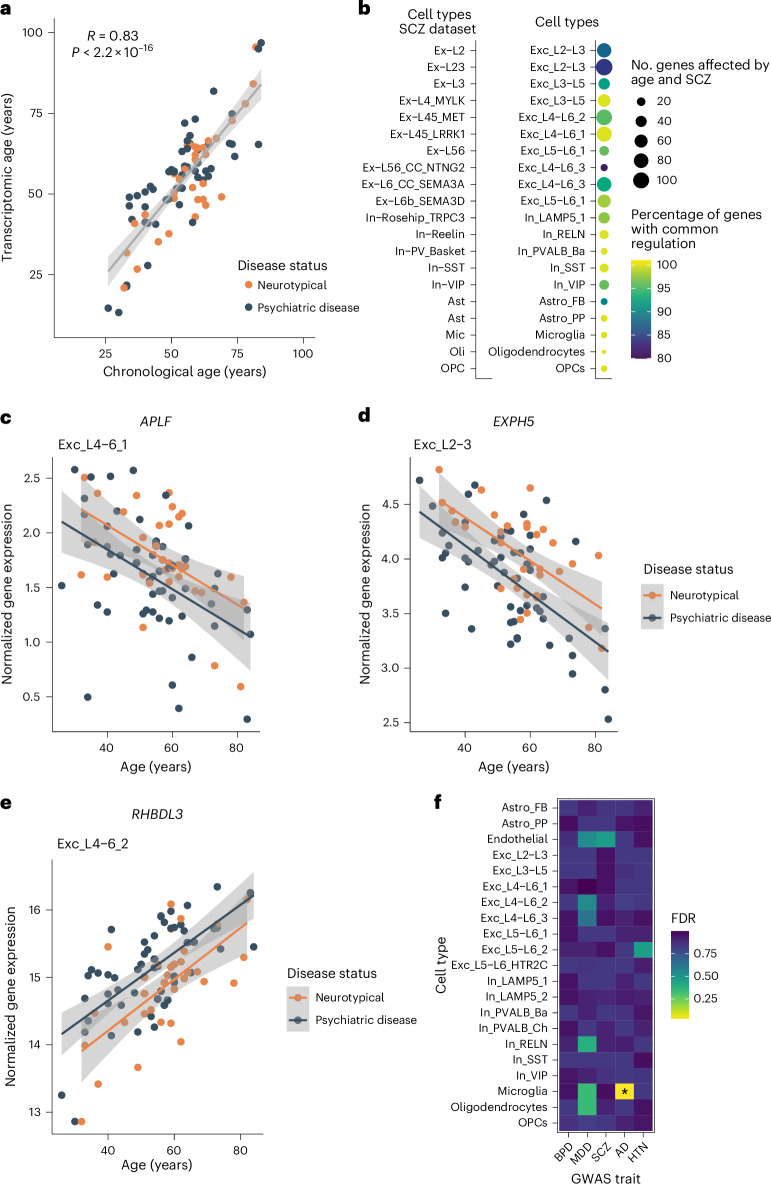
Fig. 7. Evidence for accelerated transcriptomic age in psychopathology.
a, Scatter plot showing the Pearson’s correlation (R; two sided) between chronological age (x axis) and transcriptomic age (transcriptomic brain age estimate; y axis). The error band represents the 95% confidence interval. b, Number of genes associated with both age and SCZ. The size of the circle is proportional to the number of overlapping genes, and color indicates the percentage of genes regulated in the same (common) direction across respective cell types. c–e, Normalized expression (log-transformed) across aging (corrected for covariates) of genes associated with both aging and disease status in respective cell types (APLF (c), EXPH5 (d) and RHBLD3 (e)). Error bands represent the 95% confidence interval. f, Heat map depicting the enrichment of genes implicated by GWAS for several traits in age-associated genes across cell types. Enrichment was tested using H-MAGMA’s two-sided gene property analysis (linear regression model), followed by multiple testing correction (FDR). Color indicates the FDR-adjusted P value. Asterisks (*) indicate an FDR-adjusted P < 0.05 (for microglia, FDR-adjusted P = 0.033); BPD, bipolar disorder; HTN, hypertension.

