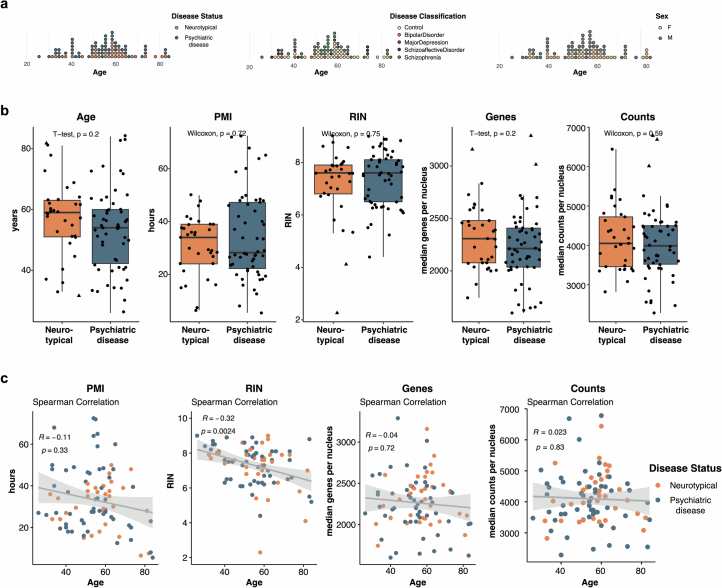
Extended Data Fig. 1. Cohort Parameters.
a, Age distribution of cohort colored by controls and cases (neurotypical individuals and individuals with a pyschiatric disease) (left), colored by disease classification (middle), and colored by females (F) and males (M) (right) used for the single-nucleus RNA sequencing. b, Boxplots showing (from left to right) age, post-mortem interval (PMI), RNA integrity number (RIN), median number of genes and median number of counts between individuals with a pyschiatric disease (N = 54) and neurotypical individuals (N = 33). The type of test (as indicated in the plots) used was dependent on whether the data was normally distributed (t-test) or not (Mann-Whitney U test); tests were two-sided. Boxplots show the median (center), IQR (bounds of box), and whiskers extending to either the maxima/minima or to the median ± 1.5× IQR, whichever is nearest. Triangles indicate outliers. c, Spearman correlation (two-sided) of age and (from left to right) PMI, RIN, median number of genes and median number of counts.

