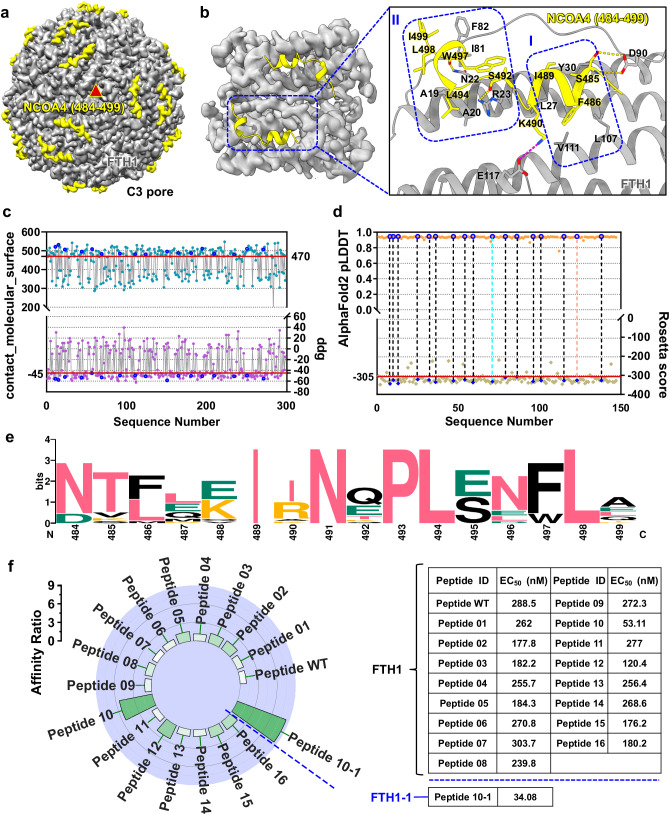
Fig. 1. Engineering, characterization, and screening of peptide adapters based on the structure of the NCOA4/FTH1 complex.
a Front view of the 24-mer single-particle cryo-EM density map of the NCOA4 (484–499)/FTH1 complex at the central point of threefold symmetry axes. NCOA4 (484–499) colored yellow and FTH1 colored gray. b Structural analysis of the NCOA4 (484–499)/FTH1 complex. Residues comprising hydrophobic cores I and II are enclosed. Interface residues are labeled and represented as sticks. Hydrogen bonds are depicted with yellow dashed lines, and salt bridges are depicted with magenta dashed lines. c After designing sequences using ProteinMPNN, Rosetta score, Rosetta binding energy (ddg) values and packing (contact_molecular_surface) were calculated by Rosetta. Red lines serve as baselines, indicating the median values of ddg and contact_molecular_surface. Sequences falling within the threshold defined by the two red lines are excluded. The blue circles represent the values of ddg and contact_molecular_surface for sequences that have undergone subsequent experimental characterization. d Precise sequence screening based on the Rosetta score and the AlphaFold2 pLDDT. The red line represents the baseline, indicating the median value of the Rosetta score. The blue circles highlight the evaluation values of the Rosetta score and the AlphaFold2 pLDDT for sequences that have undergone subsequent experimental characterization. e Amino acid conservation analysis of all peptide sequences utilized for experimental characterization using WebLogo. f Analysis of the binding affinity between the engineered peptide and ferritin. The affinity of various designed peptides was compared to that of the wild-type peptide, with the affinity of the wild-type peptide for FTH1 (EC50 = 288.5 nM) set as the baseline value of 1. The increase in affinity of the designed peptides relative to the baseline value is depicted, with a color gradient from white to green indicating an increase in affinity from low to high. The table on the right displays specific EC50 values characterizing the binding affinities of various peptides. The EC50 values were obtained through nonlinear regression dose-response stimulation analysis of ELISA data using GraphPad Prism 8.0.2 software with the log(agonist) vs. Response-variable slope (four parameters) model. Each value represents the average of three repeated experiments.

