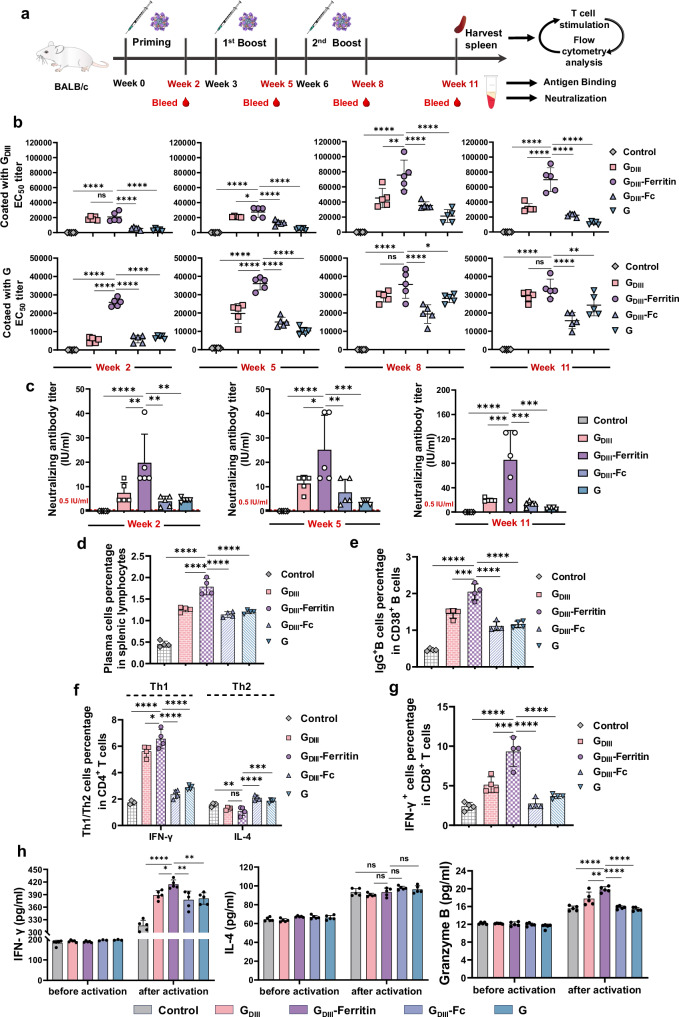
Fig. 5. Immunogenicity assessment of the rabies subunit vaccines.
a Schematic representation of the mouse immunization process (n = 5). b Titers of GDIII/G-specific serum-binding antibodies induced by different vaccines at 2, 5, 8, and 11 weeks after priming immunization. The upper panel shows the antigen GDIII. The lower panel shows the antigen G (n = 5). c Titers of neutralizing antibodies in mouse sera from different immunization groups at 2, 5, and 11 weeks after priming immunization (n = 5). The titers plotted were from rabies live virus (CVS-11) neutralization experiments. d Statistical analysis of the frequency of antibody-producing cells (CD138+ plasma cells) in splenic lymphocytes induced by vaccines (n = 4). The gating strategy is shown in Supplementary Fig. 10a. e Statistical analysis of the frequency of IgG-specific memory B cells located in the spleen germinal centers (GCs) induced by the vaccines (n = 4). The gating strategy is shown in Supplementary Fig. 10a. f Statistical analysis of the frequency of CD4+ IFN-γ+ Th1 and CD4+ IL-4+ Th2 cells, presented as a percentage of total CD4+ T cells, reflecting the activation status of different functional T-cell subsets (n = 4). The gating strategy is shown in Supplementary Fig. 12a. g Statistical analysis of the frequency of CD8+ IFN-γ+ cytotoxic T lymphocytes, presented as a percentage of total CD8+ T cells, reflecting the activation status of cytotoxic effector T cells (n = 4). The gating strategy is shown in Supplementary Fig. 12a. h Determination of characteristic cytokines secreted by T cells isolated from the spleens of experimental mice before and after activation (n = 5). The concentrations of serum cytokines were calculated by fitting the OD450 values obtained from ELISA to the regression line equation. All spleen lymphocytes used for cell typing were derived from mouse spleens 5 weeks after the second booster immunization. In (b–h), all experiments were conducted independently in triplicates, all the data represented as mean ± SEM and were analyzed using one-way ANOVA followed by Tukey’s multiple comparison post hoc test. ns (not significant), *p < 0.05, **p < 0.01, ***p < 0.001, ****p < 0.0001. Source data are provided as a Source Data file.

