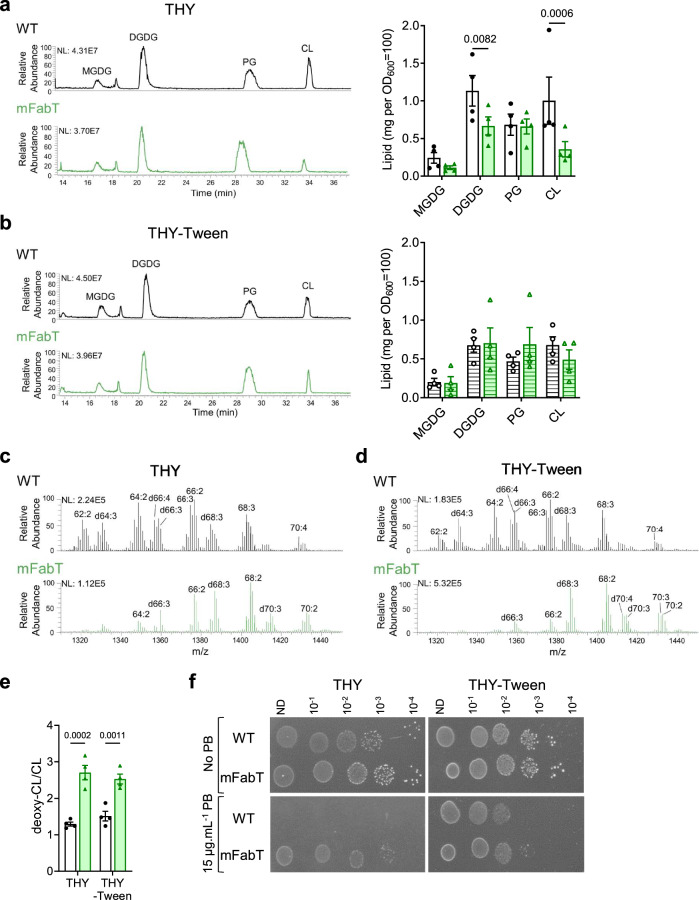
Fig. 1. FA differences in WT and mFabT strains impact lipid content and composition.
a, b HPLC-MS profiles represent the main lipid classes in WT and mFabT grown in indicated media to OD600 = 0.5; lipid profiles and quantifications by class. Lipid concentrations correspond to milligrams extracted from OD600 = 100 equivalents. MGDG, monoglucosyldiacylglycerol; DGDG, diglucosyldiacylglycerol; PG, phosphatidylglycerol; CL, cardiolipin (Supplementary Table 3). c, d, e CL species in WT and mFabT, showing putative deoxidized cardiolipin species (deoxy-CL, designated by a ‘d’ preceding acyl chain features; see Supplementary Table 2); a, b, N = 4, c, d, N = 3, where N corresponds to the number of extractions from independent samples used to identify the lipid species. e Represents proportions of CL and putative deoxy CL in WT and mFabT, as presented in (c, d). a, b, e 2-way ANOVA, Bonferroni post-test. a, b, e Data are presented as mean values +/- SEM. a–d NL, normalization level. Significant p-values are shown. WT, white bars; mFabT, green bars. Hatched bars indicate that culture medium contained Tween 80. f Polymyxin B sensitivity. WT and mFabT were precultured to OD600 = 0.5 in THY or THY-Tween and dilutions were spotted on the same respective solid medium supplemented or not with polymyxin B (PB). Plates are representative of 3 independent experiments. Source data for a, b, and e, are provided as a Source Data file.

