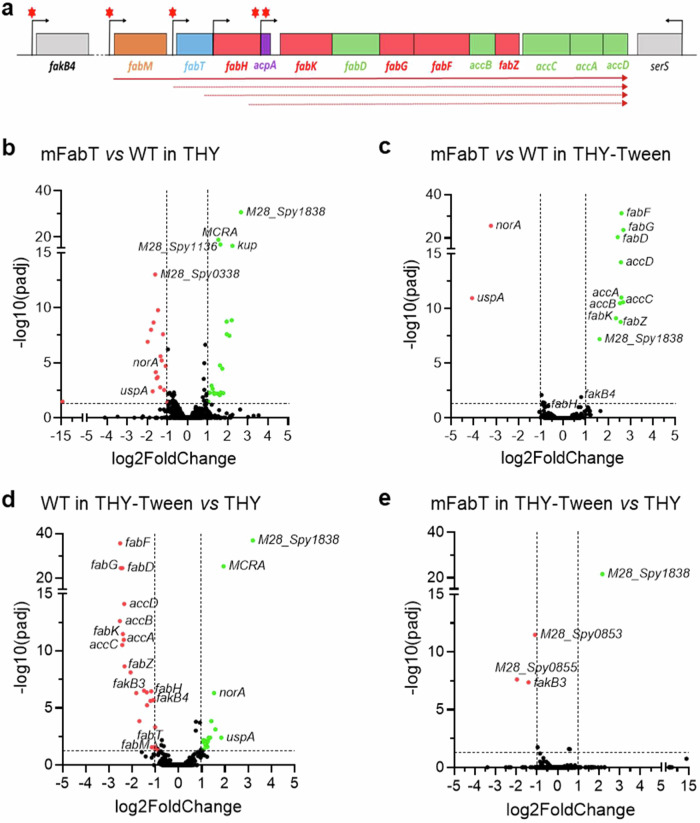
Fig. 2. FabT regulon in the presence of eFAs and genetic organization of the GAS FASII genes.
a Schematic representation of the GAS FabT regulon, comprising genes of the FASII locus and fakB4. Gene positions with names below are represented. Red asterisks, putative FabT binding sites3; bent arrows, transcription start sites; solid arrow, transcript defined by RT-PCRs; dotted arrows, transcripts from previously reported start sites19. b–e Volcano plots of differentially expressed genes, compared as indicated. See Supplementary Table 4 for a complete list. Volcano plots were constructed using GraphPad Prism, by plotting the negative base 10 logarithm of the p-value on the y axis, and the log of the fold change (base 2) on the x axis. P-values for comparisons of peak intensities were calculated by two-sided T-test. Statistical significance was validated by the one-sided Wald test. Padj: calculated p-values were adjusted for multiple testing using the false discovery rate controlling procedure (see Methods section). Gene expression was considered modified in a given condition when the absolute value of log2-Foldchange (FC) was greater than or equal to 1, with an adjusted p-value ≤ 0.05. Data points with low p-values (highly significant) appear at the top of the plot. Source data for b, c, d, and e are provided as a Source Data file.

