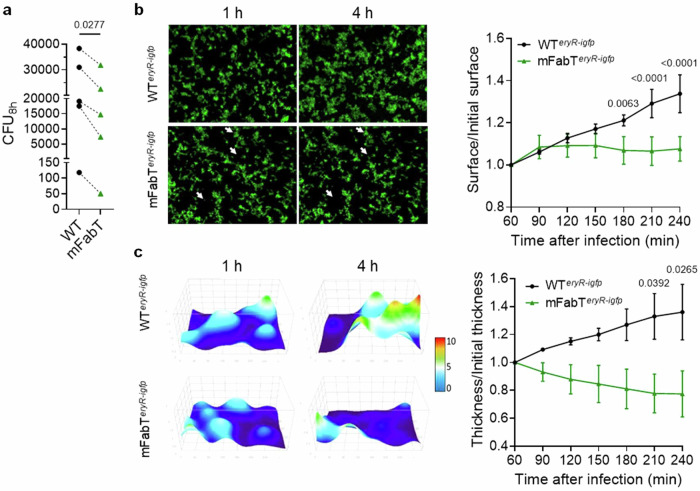
Fig. 3. The mFabT strain grows poorly on human tissue ex vivo.
a Comparison of GAS WT and mFabT cfus after 8 h growth in static conditions in the presence of human decidua tissue. Bacterial multiplication at the tissue surface in flow conditions (live imaging); b left, Visualization of WTeryR-igfp and mFabTeryR-igfp multiplication in 2D. Poor mFabT growth led to nearly identical images at 1 and 4 h, with some differences highlighted by white arrowheads; right, ratios over time of areas covered by the two strains. c left, 3D-surface heat map of bacterial layer thickness at 1 and 4 h. The x, y, and z axes are scaled, color code in µm; right, ratios over time of bacterial layer mean thickness of WTeryR-igfp and mFabTeryR-igfp strains on decidual tissue. Determinations were based on N = 5 for (a), N = 3 for (b, c), where N corresponds to the number of independent biological replicates performed per condition. For b and c, representative results are shown, and data are presented as mean values +/- SEM. Statistical analyses were done for (a), by a two-sided T test; for (b) and (c), by 2-way ANOVA, Bonferroni post-test. Significant p-values are shown. WT, black symbols or lines; mFabT, green symbols or lines. Source data for (a), (b), and (c) are provided as a Source Data file.

