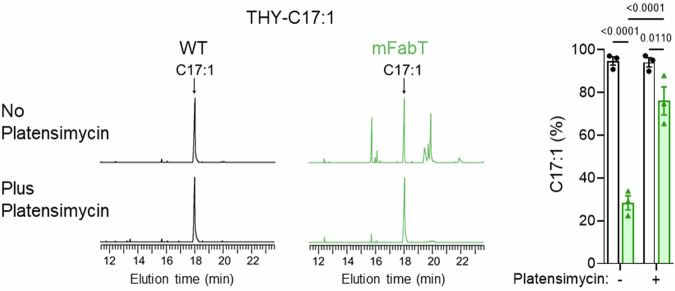
Fig. 6. Continued FASII activity in the mFabT mutant leads to lower eFA incorporation.
Membrane FA profiles were compared in WT and mFabT strains grown in THY-C17:1 (100 µM), containing or not the FASII-inhibitor platensimycin (1 µg/mL−1). Left, Representative FA profiles; right, quantified proportions of major FAs. Both strains grew in C17:1 regardless of the presence of platensimycin (Supplementary Table 6). N = 3, where N corresponds to the number of independent biological replicates used in analyses. Data are presented as mean values +/- SEM; 2-way ANOVA, Bonferroni post-test was performed. Significant p-values are shown. WT (black lines, white bars) and mFabT (green lines and bars). Source data are provided as a Source Data file.

