

Abstract
Context
We perform density functional theory calculations to study the dependence of the structural and electronic properties of the amino acid sarcosine crystal structure on hydrostatic pressure application. The results are analyzed and compared with the available experimental data. Our findings indicate that the crystal structure and properties of sarcosine calculated using the Grimme dispersion-corrected PBE functional (PBE-D3) best agree with the available experimental results under hydrostatic pressure of up to 3.7 GPa. Critical structural rearrangements, such as unit cell compression, head-to-tail compression, and molecular rotations, are investigated and elucidated in the context of experimental findings. Band gap energy tuning and density of state shifts indicative of band dispersion are presented concerning the structural changes arising from the elevated pressure. The calculated properties indicate that sarcosine holds great promise for application in electronic devices that involve pressure-induced structural changes.
Methods
Three widely used generalized gradient approximation functionals—PBE, PBEsol, and revPBE—are employed with Grimme’s D3 dispersion correction. The non-local van der Waals density functional vdW-DF is also evaluated. The calculations are performed using the projector-augmented wave method in the Quantum Espresso software suite. The geometry optimization results are visualized using VMD. The Multiwfn and NCIPlot programs are used for wavefunction and intermolecular interaction analyses.
Supplementary Information
The online version contains supplementary material available at 10.1007/s00894-024-06110-z.
Keywords: N-methylglycine, Hydrostatic pressure, Electronic structure and properties, Non-covalent interactions, Density functional theory calculations, Dispersion interactions, Band gap energy tuning
Introduction
Amino acids exist in neutral and zwitterionic forms, depending on whether in the gas or liquid phases [1]. When amino acids are in a polar solvent or the crystalline phase, they typically exhibit the zwitterionic form [2]. In the liquid phase, the interactions between amino acids and water molecules can lead to proton transfer [1].
Sarcosine (N-methylglycine) is a derivative of the amino acid glycine, whose neutral form and zwitterion chemical formulas are CH–NH–CH–COOH and CH–NH–CH–COO, respectively. According to the crystal structure determined experimentally by X-ray diffraction, the solid phase sarcosine exists in its zwitterionic form [3]. Glycine is the simplest amino acid with three polymorphs under ambient conditions [4]. Additionally, one can observe more than one polymorph in glycine depending on the applied pressure [5]. According to Fleck and Petrosyan [6], glycine is an example of polymorphs’ existence in crystalline form. In contrast, sarcosine crystals are orthorhombic and have a space group of P222 at ambient conditions [3]. Sarcosine is an essential amino acid that contains a carbon atom involved in transmethylation reactions [7]. It is found naturally in starfish, sea urchins, and the antibiotic actinomycin [3, 7, 8]. Additionally, sarcosine has been identified as a differential metabolite that has significantly elevated concentration during prostate cancer’s progression to metastasis [9]. This metabolite can be detected non-invasively in urine. It may help distinguish between slow-growing and aggressive prostate cancers, making it suitable as a biomarker for monitoring prostate cancer progression [10].
Organic and semi-organic crystals derived from amino acids have been studied over the past few decades for their potential applications in optoelectronics, communications, sensors, and data storage devices [11–16]. These investigations cover several topics, such as the stability of the crystalline structure under different conditions. Polymorphs of amino acids under the application of pressure and the study of the anisotropy of pressure-induced structural distortions accompanied by a phase transition [17–23]. Under pressure, it is essential to understand the molecular flexibility associated with changes in hydrogen bonding behavior and gain insights into this type of interaction, which directly influences the stability of organic crystals. Sabatini et al. [24] explained that the study of organic materials under pressure is of great interest in several areas, from the industrially relevant issue of pressure treatment of food products to academically valuable studies of extremophilic bacteria living in the Earth’s crust or the depths of the oceans. The authors point out that high-pressure studies are also essential for exploring the new phases of molecular crystals and their stability, such as crystal structure prediction.
Experimental studies conducted by Kapustin et al. [25] reveal that the orthorhombic phase of sarcosine crystals undergoes a structural rearrangement when subjected to pressure. However, the extent of the phase transition varies upon increasing pressure rates and reverse decompression. They observed that the structural rearrangement occurred in sarcosine single crystals when quickly compressed while maintaining over-pressured ambient pressure phases during slow compression. Based on results collected under increasing pressure up to 3.7 GPa, the authors suggest that, given enough time, the structure will adapt to the pressure without undergoing significant structural changes or crystal fragmentation.
The systematic experimental investigation of high-pressure behavior using X-ray diffraction provides a comprehensive understanding of the properties of compounds, including structural, electronic, and optical system properties, which is essential for exploring and evaluating their potential technological applications. Conducting experimental studies under high-pressure conditions is a highly complex process [22]. It involves utilizing synchrotron radiation X-ray diffraction [26] and expensive Raman spectroscopy equipment. Furthermore, a diamond anvil cell containing a fluid for quasi-hydrostatic pressure transmission [27, 28] may also be required. A precise and thorough analytical examination of theoretical studies can augment the portrayal of compound properties. A complete understanding of these properties is essential to comprehend potential technological applications.
Over time, density functional theory (DFT) has been both a complement to experimental research and an efficient method for high-pressure studies of molecular crystals [29–32]. Schatschneider et al. [33] investigated oligoacenes structural and electronic properties under pressures ranging from ambient to 25 GPa. An excellent agreement was observed between theoretical predictions and experimental data at ambient and high-pressure conditions in the dihydroxylammonium 5,5’-bistetrazole-1,1’-diolate system [34]. The vibrational frequencies were experimentally measured and reproduced theoretically using DFT [34].
There have been numerous theoretical studies employing first-principles calculations using DFT through the application of the generalized gradient approximation (GGA) for amino acids, such as L-alanine [24, 35], L-leucine [35], L-isoleucine[35], -glycine [24, 36], and -glycine [24], L-serine [37], L-asparagine [38], L-threonine [39], and L-histidine crystals [40]. However, most of these works have attempted to explain the optical, structural, and electronic properties only at ambient pressure.
In this study, we investigate the impact of applied pressure on orthorhombic sarcosine crystals’ structural and electronic properties using four dispersion-corrected DFT methods. We aim to evaluate these methods’ performance in predicting the structural and bonding changes in the crystal structure associated with pressure—the prospective technological applications of sarcosine in different environments. The calculated properties are compared to our computational results on the structural properties of orthorhombic sarcosine with experimental reports as the hydrostatic pressure increases. The findings are essential for evaluating the suitability of sarcosine for technological applications.
Computational methods
The projector-augmented wave (PAW) method performs the DFT calculations in the Quantum Espresso software suite [41]. The exchange-correlation contributions are described using the Perdew–Burke–Ernzerhof (PBE) [42], PBE for solids (PBEsol) [43, 44], and revised PBE (revPBE) [45] GGA functionals, as well as the non-local van der Waals vdW-DF functional [46]. Grimme’s D3 dispersion term is applied in conjunction with all GGA functionals to correct for dispersion interactions [47].
The sarcosine crystal’s lattice parameters and atomic positions at ambient pressure are obtained from the work of Kapustin et al. [25] and used as input for the unit cell structure optimization. Each unit cell contains four sarcosine molecules in the non-centrosymmetric space group P222 of the orthorhombic system, a = 6.6583(1) Å, b = 7.8903(1) Å, c = 8.6069(1) Å (Table 1) under ambient conditions [25]. The geometry optimization is considered converged at 10 eV Å.
Table 1.
Optimized unit cell parameters (in Å) and unit cell volume (in (Å) of sarcosine orthorhombic phase under ambient conditions
| XC | a (Å) | a (Å) | b (Å) | b (Å) | c (Å) | c (Å) | V (Å) | V(Å) |
|---|---|---|---|---|---|---|---|---|
| PBE | 6.599 | 0.057 | 7.824 | 0.066 | 8.672 | 0.065 | 447.84 | 4.17 |
| revPBE | 6.266 | 0.390 | 7.883 | 0.007 | 8.729 | 0.122 | 431.25 | 20.76 |
| PBEsol | 6.336 | 0.320 | 7.698 | 0.192 | 8.568 | 0.039 | 418.03 | 33.98 |
| vdw-DF | 6.606 | 0.050 | 8.066 | 0.176 | 8.886 | 0.279 | 473.57 | 21.56 |
| Exp | 6.6558 (1) | 7.8903 (1) | 8.6069 (1) | 452.01 (2) |
Deviations from the experimental values obtained by Kapustin et al. [25] are also shown
The Monkhorst Pack scheme [48] samples the Brillouin zone through a 222 k-point grid. The cut-off energy for the PAW basis set is set to 50 Ry. The bulk modulus is calculated using the EOSFIT code [49].
To examine how pressure affects sarcosine’s electronic structure and properties, we apply discrete hydrostatic pressures (0.0, 0.2, 0.8, 1.4, 2.1, 2.9, 3.4, and 3.7 GPa). Starting from the ambient pressure (given as 0.0 GPa, following the experimental notation), the unit cell is fully optimized by applying hydrostatic pressure step by step. No symmetry constraint is used during the geometry optimizations at elevated pressure, and the optimized unit cells remain orthorhombic. These pressure values are selected to reproduce the experimental conditions investigated by Kapustin et al. [25].
The program for plotting non-covalent interaction regions (NCIPlot) analysis [50] calculates the intermolecular interactions in the sarcosine crystals and obtains an improved understanding of their nature. The Multiwfn 3.8 program is used to explore and reveal both intra- and intermolecular interactions [51]. The Visual Molecular Dynamics (VMD) 1.9.4 is employed to visualize the results [52].
Results and discussions
Structural properties at ambient pressure
The lattice parameters a, b, c and the volume, optimized under ambient pressure for the orthorhombic phase of sarcosine, are listed in Table 1. The optimized lattice parameters are less than a 2% deviation from the experimental values of Kapustin et al. [25]. The unit cell optimized using the PBE functional is shown in Fig. 1.
Fig. 1.
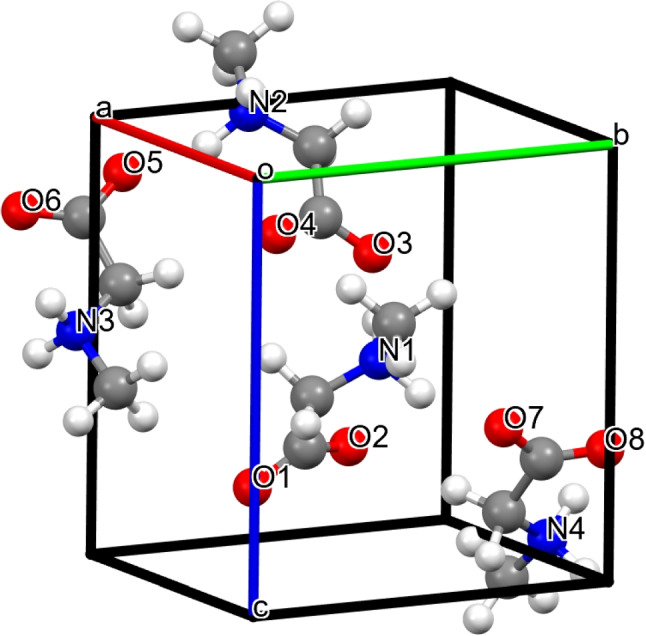
Optimized unit cell of sarcosine using PBE-D3 method, showing head-to-tail chains linked via N-HO hydrogen bond. Atom colors: C, dark gray; H, light gray; O, red; N, blue
The exchange-correlation functionals influence the calculated cell parameters and volumes [24]. On average, the results indicate an underestimation of the a and b axes. Specifically, the volume for PBE is underestimated by 0.92%, revPBE by 4.59%, and PBEsol by 7.52%. Conversely, vdw-DF overestimates the volume by +4.77%. The vdW-DF method, while providing excellent results for structural parameters compared to experimental values [25], exhibits the typical GGA overestimation of the experimental volume [24]. Hyldgaard et al. [53] have demonstrated the vdW-DF functional’s accuracy. Concerning the specific lattice parameters, it is notable that PBE provides unit cell parameters that are in excellent agreement with the experimental values, as shown by an error of only 4.17 Å, or 0.92% relative to the experimental unit cell volume, and an error of only 0.065 Å, or 0.76% relative to the experimental c-axis. Based on our findings, it is clear that the selection of the exchange-correlation functional plays a critical role in the accurate optimization of structural parameters.
Figure 1 illustrates the orthorhombic unit cell of the sarcosine crystal, which forms an infinite head-to-tail zigzag chain (Fig. 2) via N-HO hydrogen bonds along the c axis and has two H atoms in each amino group. The length of the intramolecular bond calculated using the PBE functional is 2.72 Å (Fig. 2). This value is 1.31% smaller than the experimental results reported by Kapustin et al. [25]. According to Kapustin et al. [25], each zwitterionic sarcosine molecule can create two N-HO hydrogen bonds with other molecules, forming a three-dimensional network stabilized by charge-assisted intermolecular hydrogen bonds. The zwitterions are aligned in head-to-tail chains along the crystallographic b and c axes. Table 2 compares the calculated intramolecular hydrogen bonds of the investigated compound with the experimental data [25]. The atom numbering in Table 2 is according to Fig. 1. The geometry optimization results are in excellent agreement with the findings of Kapustin et al. [25]
Fig. 2.

Optimized 222 super cell of sarcosine crystal, showing N-HO intermolecular bonds formed by periodically extended head-to-tail chains (PBE-D3 method)
Table 2.
Optimized N-HO hydrogen bonds and carboxylate C−O (Å) bonds in sarcosine crystal at ambient pressure
| Exp. [25] | PBE | revPBE | PBEsol | vdw-DF | |
|---|---|---|---|---|---|
| N1-HO2 (Å) | 2.7604 (14) | 2.724 | 2.733 | 2.670 | 2.812 |
| Bond angles (deg) | 172.2 (13) | 171.02 | 171.34 | 171.85 | 170.84 |
| N2-HO3 (Å) | 2.7879 | 2.762 | 2.763 | 2.710 | 2.854 |
| Bond angles (deg) | 158.6 (13) | 156.18 | 154.38 | 155.65 | 155.12 |
| C-O3(Å) | 1.2660 | 1.282 | 1.284 | 1.281 | 1.257 |
| C-O2(Å) | 1.2353 | 1.251 | 1.253 | 1.248 | 1.285 |
Atom numbering is according to Fig. 1
While the GGA functionals (PBE, PBEsol, and revPBE) underestimate the values of the intermolecular bond lengths, the vdw-DF functional overestimates the values of the two hydrogen bonds (Table 2). According to these results, all functionals describe the donor-acceptor length reasonably well, within a range of 3% of the experimental values. On the one hand, the average deviation of the bond length obtained using the PBE functionals is only 1.86%, where the negative sign indicates that the value is underestimated. On the other hand, the average deviation of the bond length using the vdw-DF functional is +2.12%, where the positive sign indicates that the value is overestimated concerning the experimental one. The challenge of calculating intermolecular bond lengths using first-principles calculations has been highlighted by Prazyan et al. [54]. Based on our results presented in Tables 1 and 2, it can be observed that the PBE functional with dispersion correction (PBE-D3) gives outstanding values compared to the experimental data, in terms of unit cell dimensions, bond lengths, and angles. Thus, the PBE-D3 method is selected for the studies presented below.
The two C−O distances in each carboxylate group of the zwitterions in sarcosine are very different. For both bonds, the same O atom of the carboxylate group (O) acts as an acceptor. Kapustin et al. have explained this behavior [25] as an essential involvement of the two O atoms in the formation of hydrogen bonds. Notably, Sabatini et al. [24] observe a similar phenomenon using GGA functionals. These authors reported that the results of the amino acids L-alanine and glycine tend to underestimate the crystal lattice parameters and describe the bond length reasonably well. The average deviations of the calculated bond lengths from the measured data are not surprising since it is well known that DFT describes the intramolecular covalent interactions with GGA exchange-correlation functionals [55].
Electronic properties at ambient pressure
Molecular crystals are commonly regarded as electronic insulators based on the well-established literature [56]. The stability of these systems relies primarily on hydrogen bonds and dispersion interactions [57]. Calculating the band structure, the total density of states (TDOS), and the orbital-projected density of states (PDOS) is crucial to comprehend the electronic characteristics of these materials.
The calculated band structure, TDOS, and PDOS of sarcosine using the PBE-D3 method are shown in Fig. 3. The system under investigation shows a direct band gap at ambient pressure (along the point). The calculated band gap is approximately 5.04 eV. This finding is consistent with other amino acids and indicates that the compound has electronic insulator properties [58]. Furthermore, the energy bands in the studied system exhibit low-energy dispersion. The findings pertain to the intermolecular interactions of sarcosine molecules within the unit cell and the resulting insulator behavior in this configuration [59, 60]. In the literature, it has been reported that the PBE functional underestimated electronic band gaps. Several authors have already used this GGA exchange-correlational functional for band gap calculations of molecular crystals. Table 3 shows the calculated and the experimental electronic band gap for similar amino acids crystal systems. According to Table 3, one can observe a good agreement between the experimental and calculated values in most cases.
Fig. 3.

(Top) Band structure and (bottom) total and projected density of states of sarcosine crystal system at 0.0 GPa, calculated using the PBE-D3 method
Table 3.
Comparison of some amino acid values of the band gap reported in the literature
Tulip and Clark’s article [35] calculated the electronic properties using DFT via GGA approximation on alanine orthorhombic crystals and leucine, isoleucine, and valine monoclinic crystals. In particular, Flores et al. [36] reported a theoretical band gap energy value of 4.95 eV for monoclinic crystals . -glycine. Using GGA-PBE DFT calculations, Cândido Junior et al. reported a theoretical band gap value of 4.52 eV for the orthorhombic cysteine crystals [58]. The theoretical band gap value for the anhydrous monoclinic L-asparagine crystal was calculated as 4.23 eV using the GGA-PBE level of theory [38]. Moreover, according to the GGA-PBE calculations performed by Costa et al. [37], the anhydrous L-serine crystal has a theoretical band gap of 4.80 eV. Zanatta et al. obtained the band gap value for the anhydrous monoclinic L-asparagine crystal at 4.23 eV through the theoretical level GGA-PBE [38]. Pereira et al. obtained a theoretical band gap value of approximately 4.38 eV for the monoclinic L-histidine crystal using the same level of theory previously reported [40].
The TDOS and PDOS plots (Fig. 3, bottom) show each band’s main atomic orbital contributions. From these PDOS plots, one can note that the top of the valence band is mainly due to hybridization between O 2p, C 2p, and N 2p states in this region. On the other hand, the lower part of the conduction band is mainly composed of C 2p states. The hybridization shown in this TDOS-PDOS plot describes the covalent interaction formed between C–O and C–N groups of the sarcosine system.
Non-covalent interaction at ambient pressure
Non-covalent interactions are essential for understanding the stabilization of molecular structures through intra- or intermolecular interactions [61]. Therefore, the theoretical NCIPlot method evaluates all interactions in the compound studied. The NCIPlot is a visualization index calculated based on the electronic density and its reduced gradient and represented using reduced density gradient (RDG) maps [50, 61].
The 3D NCIPlot isosurfaces of sarcosine crystals at ambient pressure are obtained and displayed using the Multiwfn [51] and VMD programs [52], respectively, as shown in Fig. 4. The different types of non-covalent interactions occurring in the compound are represented by the color coding scheme: red for steric interaction, blue for hydrogen bonding, and green for van der Waals interaction [62, 63]. In the isosurface plot, the bright blue distributions observed between the carboxylate groups and the amine groups, namely the nitrogen atom of sarcosine and the oxygen atom of the carboxyl group, show the hydrogen bonding attraction (N-HO with a distance of 2.72 Å and N-HO with a distance of 2.76 Å) (Table 2, PBE) over the intermolecular interaction, which is in a good agreement with the structural results. According to Tulip and Clark [35], some amino acids (alanine, leucine, isoleucine, and valine) are expected to be energetically favorable to form zwitterions. Furthermore, zwitterionization has implications for the nature of the hydrogen bond between the amino and carboxylate groups. Similar behavior is observed in L-valine, where the hydrogen bond formed is more robust, when zwitterionization occurs [35].
Fig. 4.
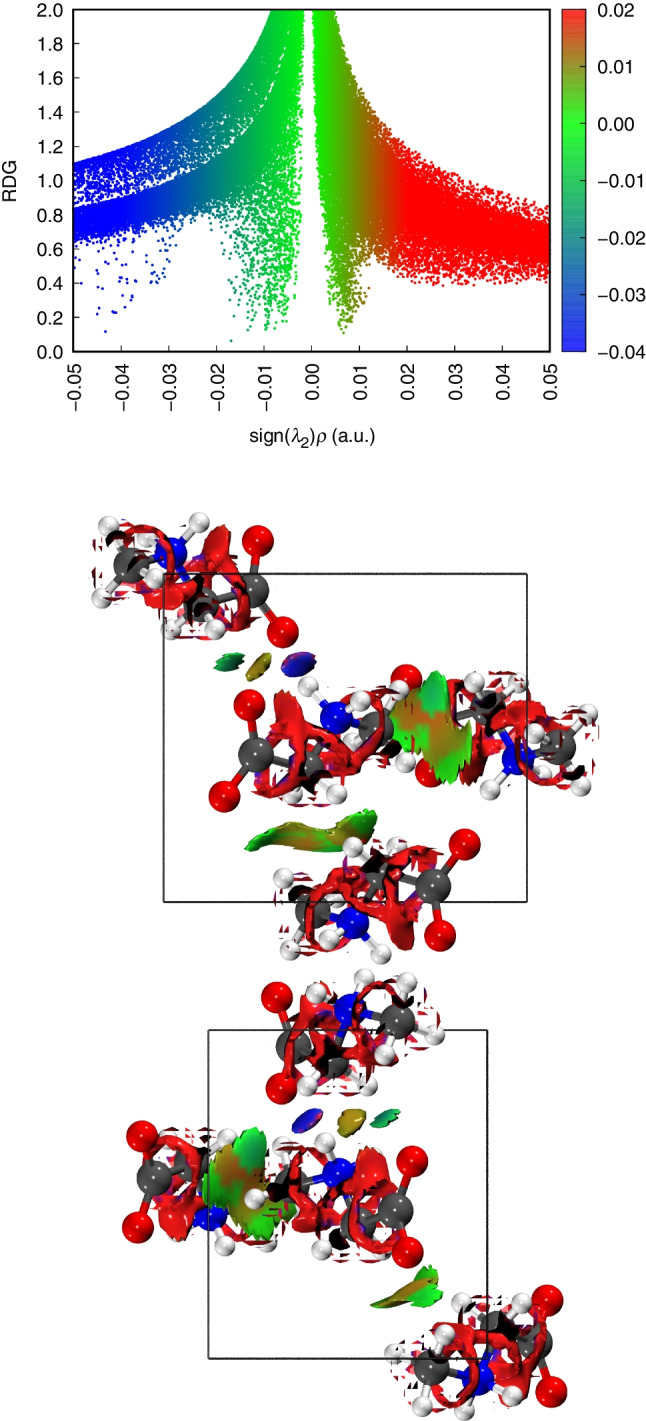
Reduced density gradient (RDG) map and NCIPlot of the gradient isosurface of sarcosine crystal at 0.0 GPa, calculated using the PBE-D3 method. Top: scatter graph; middle: noncovalent interactions along the a axis; bottom: noncovalent interactions along the c axis
The red spots near the carbon atoms indicate the steric repulsion effect. In contrast, the van der Waals interactions occur between the atoms marked by the green spots (Fig. 4, middle and bottom). The RDG and NCIPlot results illustrate that a combination of hydrogen bonding, low steric, and van der Waals interactions collectively stabilize the sarcosine crystal.
Structural properties at elevated pressure
The calculated lattice parameters and cell volumes under elevated pressure application are sensitive to the exchange and correlation functionals used. The values of lattice parameters at elevated pressure are plotted in Fig. 5. On average, these results underestimate the a and b axes. Using the PBE functional, the volume is underestimated by 0.92%. The revPBE and PBEsol functionals underestimate the volume by 4.59% and 7.52%, respectively. The volume calculated using the non-local vdw-DF is overestimated by +4.77 (Fig. 5). One can show the relative changes in the lattice parameters by varying the lattice parameters from low to high pressure (Fig. 6). Additionally, the unit cell is less rigid along the b direction than for the a and c directions. Similar behavior is observed in the L-asparagine crystal reported by Zanatta et al. [38]. These results show that typical GGA functionals with Grimme-D3 correction, such as the PBE-D3 method, describe the key structural parameters of sarcosine better than the non-local vdw-Df functional. We can see that the PBE functional with Grimme’s correction yields results that are in the closest agreement with the experimental values. It is worth noting that the orthorhombic crystal structure observed experimentally at ambient pressure undergoes system rearrangements during the application of external pressure, such as a rotation of molecules around intermolecular bonds. Kapustin et al. [25] reported that increasing pressure leads to compression of the head-to-tail chains and a complex interplay of distortions in the N-HO hydrogen bonds and changes in molecular conformations related to the rotation of the methyl group occurs.
Fig. 5.

Optimized unit cell dimensions and volume of sarcosine at pressures from 0.0 to 3.7 GPa. Trend lines are guides to the eye
Fig. 6.

Relative changes in cell parameters of sarcosine versus pressure compression, calculated using PBE functional. Black triangles, crystalographic a axis; red squares, b axis; blue circles, c axis. All curves are guide to the eye
The pressure dependence of the lattice parameters and volume using the PBE functional is presented in Fig. 5. The direction of maximum compression occurs along the a axis; from ambient pressure to 2.1 GPa, the structure compresses 10.92% in this direction and then expands to reach 10.26% at 3.7 GPa. These effects are in excellent agreement with the experimental results reported by Kapustin et al. [25]. According to these authors, the non-monotonic changes in linear strain along the a axis can be interpreted in terms of the initial closing of the interstitial voids at lower pressures, followed by structural compression preferably along the head-to-tail chains at pressures higher than 2.1 GPa. The direction of minimum strain is observed along the c crystallographic axis. i.e., in the direction of the head-to-tail chains formed by the shortest N2-H1O1 hydrogen bonds.
Figure 7 shows sarcosine’s calculated intermolecular hydrogen bonding behavior under compression-induced pressure changes. The N1−HO2 (Fig. 7 left) and N2−HO3 (Fig. 7 right) behave very differently in terms of pressure-induced variation. While N1−HO2 is the more robust (or the “main,” based on the definition proposed in ref. [25]) hydrogen bond, the N2−HO3 bond is the weaker (or the “additional” [25]) one, according to ref. [64], the experimental compression caused bond distortions under elevated pressure. X-ray diffraction also observed a similar effect for the three glycine polymorphs [4]. The line trends obtained in the theoretical calculations (Fig. 7) are in agreement with the experimental behavior observed by Kapustin et al. [25].
Fig. 7.

Donor–acceptor distances in the N–HO hydrogen bonds in sarcosine with increasing pressure (from ambient pressure to 3.7 GPa), calculated using the PBE-D3 method. Left: N1-HO2; right: N2-HO3. Trend lines are guides to the eye
Compressibility
The third-order Murnaghan equation of state fits the pressure (P) dependence of the theoretical unit cell volumes (V) [65] with different V and P coefficients:
| 1 |
where is the unit cell volume at . The isothermal bulk modulus and pressure derivative are and , respectively. The bulk modulus of a substance is a measure of its resistance to bulk compression or compressibility. The constants and have been theoretically evaluated based on the optimized unit cell volumes with the PBE-D3 method (Fig. 5) and the above equation of state at 6.98 GPa and 7.01, respectively. The calculated bulk modulus and its derivative using the experimental parameters obtained from the work of Kapustin et al. [25] are 6.76 GPa and 5.46, respectively. The bulk modulus calculated based on unit cell optimization agrees with the value derived from the experimental data in [25]. The reported values are in good agreement with those previously studied, such as deuterated l-alanine GPa [66], 2-(--methylbenzylamino)-5-dinitropyridine (MBANP) in the range 0–0.8 GPa with value is GPa [26], and form I of Tolazamide, GPa [67]. These values suggest the structural stability of the orthorhombic system and a low bulk modulus, which indicates a high compressibility. The computation of the mechanical property of bulk modulus yields noteworthy consistency with experimental findings.
Electronic properties under elevated pressure
To understand how hydrostatic pressure affects the electronic structure of the sarcosine crystal, we examine the band structure, TDOS, and PDOS. They are shown in the Supporting Information Figs. S.1–S.7. One observes that the top of the valence band splits when external pressure is applied in all the configurations studied. The calculated values of the lowest unoccupied conduction band (LUCB), highest occupied valence band (HOVB), and band gap energies are listed in Table 4. The HOVB and LUCB are shifted to higher energy values due to the application of hydrostatic pressure. It can also be seen that the band structure becomes broadened with increasing compressive stress, as shown in Fig. S.7 for 3.7 GPa. The calculations confirm that all sarcosine crystals have a direct band gap at the symmetry point under pressure application. As seen in Table 4, the band gap energy of sarcosine gradually decreases with increasing pressure up to 1.4 GPa from 5.20 to 4.90 eV, preserving the electronic insulator nature of the studied system. As the pressure is increased, the results in Table 4 show that the band gap increases slightly from 4.99 eV (2.1 GPa) to 5.05 eV (3.7 GPa).
Table 4.
Lowest unoccupied conduction band (LUCB), highest occupied valence band (HOVB), and band gap energies of orthorhombic sarcosine crystal, calculated using the PBE-D3 method at elevated pressures
| Pressure (GPa) | 0.0 | 0.2 | 0.8 | 1.4 | 2.1 | 2.9 | 3.4 | 3.7 |
| HOVB (eV) | 0.29 | 0.51 | 0.81 | 1.07 | 1.30 | 1.55 | 1.73 | 1.86 |
| LUCB (eV) | 5.49 | 5.58 | 5.82 | 5.97 | 6.29 | 6.55 | 6.75 | 6.91 |
| Band Gap (eV) | 5.20 | 5.07 | 5.01 | 4.90 | 4.99 | 5.00 | 5.02 | 5.05 |
For all the cases investigated, the TDOS and PDOS clearly show that the top of the valence band is now mainly composed of O and C 2p states, with a small contribution from the N 2p states. In all cases, the conduction band minimum is again dominated by the O 2p states, with a small contribution from the C and N 2p states. The peaks of the HOVB C 2p, O 2p, and N 2p states decrease as the pressure is increased beyond 1.4 GPa. This decrease indicates that the C–O and C–N bond strengths decline as the pressure is increased. This behavior can be attributed to the competition between the contraction of the unit cell and the rotation of the molecules that comprise the unit cell (Supporting information - Video).
Up to a pressure of 1.4 GPa, the reduction in the size of the unit cell outweighs the rotation of the molecules that make up the molecular crystal, increasing the overlap between crystal orbitals and decreasing the band gap. Above this pressure, rotation becomes dominant. It is important to note that the rotation reduces the overlap between the orbitals involved in the band gap region in a way that the band gap increases [68]. This phenomenon is often observed in some types of perovskites [68, 69].
It is worth noting that the edges of the valence and conduction bands are shifted upwards upon applying pressure. The VB edge moved up much more than the conduction edge in the band gap reduction region. On the other hand, above 2.1 GPa, the bottom of the conduction band moves up more than the top of the valence band, leading to an increase in the band gap energy.
Non-covalent interaction at elevated pressure
As can be seen in Figs. S08–S14, the application of elevated static isotropic pressure throughout the simulation does not significantly alter the molecular arrangement that forms the molecular crystal. This is attributed to the intermolecular stabilization resulting from the hydrogen bonding interactions and the dispersion interactions, which act like “glue” and do not allow the drastic modification of the structural arrangement that forms the unit cell. Thus, the structural stability of the orthorhombic crystal cell of the studied system is maintained.
The description of the intermolecular interactions between the molecules that comprise each unit cell provides valuable information to show why the system under investigation does not undergo a phase transition when an external pressure is applied [64]. Experimentally, as pressure is applied, the structure is somewhat compressed, after which the zwitterions get closer to each other and lead to the gradual elongation of the intermolecular distances [25]. Therefore, these structural changes have been related to the closing of interstitial voids, accompanied by structural compression, preferentially along the periodically extended head-to-tail chains. It can be confirmed by considering the direction of the more compressible axes (Fig. 5).
Conclusions
We report an investigation of the crystal and electronic structure of the sarcosine crystal system under varying pressures ranging from 0 to 3.7 GPa. To achieve this, we utilize theoretical calculations using various DFT exchange-correlation functionals with dispersion corrections. After careful consideration, we use the PBE functional augmented with Grimme’s D3 dispersion correction as the primary functional for our study. This is because the PBE-D3 method provides more accurate predictions of the structural aspects of the sarcosine crystal system than the other methods evaluated.
PBE-D3 calculations show that the calculated structural properties agree well with the experimental findings. The estimated unit cell parameters show minimal deviations in comparison with experimental X-ray diffraction data: Å, Å, and Å. Key experimentally observed structural changes, such as head-to-tail chain compression and molecular rotation around intermolecular bonds, are reproduced correctly in agreement with experimental observations.
The analysis of the electronic band structure calculations confirms a small band gap tuning in the pressure range applied in this work. As the pressure increases, the band gap energy decreases, reaching a minimum of 1.4 GPa, and increases as the pressure is further increased. This pressure effect is attributed to unit cell contraction and molecular rotation interplay. The band gap energy tuning does not change the dielectric character of the molecular crystal. Band dispersion is associated with increased intermolecular interactions arising from the elevated pressure.
The NCIPlot calculations provide insights into the intermolecular interactions among the constituents of the studied molecular crystal that contribute to its stability over the range of pressures studied. Hydrogen bonding, van der Waals, and steric interactions are interpreted in terms of “zwitterionization” and the collective stabilization of the sarcosine crystal.
The PBE-D3 method enables a comprehensive investigation of the effect of hydrostatic pressure on the structure and electronic properties of the molecular crystal of sarcosine. Organic crystals undergo complex bonding rearrangements and electronic structure tuning, making them attractive for advanced technological applications.
Supplementary Information
Below is the link to the electronic supplementary material.
Acknowledgements
T. Andrade-Filho and R. Gester thank CNPq, CAPES, and PDPG/CAPES for financial support. M. Lage and A. O. Santos thank CNPq, CAPES, and FAPEMA for financial support. G. M. M. thanks CAPES and IFPA/Marabá Industrial for financial support. S.R.S. acknowledges financial support from the Government of Canada’s Interdepartmental Program of Energy Research and Development (PERD). The authors also thank the Advanced Research Computing platform provided by the Digital Research Alliance of Canada (l’Alliance de recherche numérique du Canada) for the computational facilities made available for this work.
Author contribution
All authors contributed equally to the study’s conception and design. Adenilson O. dos Santos, Rodrigo Gester, Stanislav R. Stoyanov, T. Andrade-Filho, and Mateus R. Lage prepared and discussed the conceptualization and methodology. Geanso M. de Moura wrote the first draft of the manuscript. All authors read and approved the final manuscript.
Funding
Open access funding provided by Natural Resources Canada library. This work is supported by the PDPG/CAPES and the Government of Canada’s Interdepartmental Program of Energy Research and Development (PERD) programs and FAPESPA, FAPEMA, CNPq, CAPES research funding agencies.
Data Availability
If requested.
Declarations
Conflict of interest
The authors declare no competing interests.
Generative AI usage
The authors used Grammarly Editor to improve the language and readability of this article. After using Grammarly, the content of this manuscript was reviewed and edited as needed and take full responsibility for the content of the publication.
Footnotes
Publisher's Note
Springer Nature remains neutral with regard to jurisdictional claims in published maps and institutional affiliations.
References
- 1.Meng X, Zhao H, Ju X (2010) Theoretical studies on the proton transfer through water bridges in hydrated glycine cluster. Commun Comput Inf Sci 289–296
- 2.Sharma P, Singh DK, Gupta V, Asthana B, Mishra P, Singh RK (2013) Study of hydration of sarcosine, formation of its zwitterion and their different oligomers in aqueous media: a Raman spectroscopic and theoretical study. Spectrochim. Acta A Mol Biomol Spectrosc 116:74 [DOI] [PubMed] [Google Scholar]
- 3.Mostad A, Natarajan S, Wilkins RG, Legendziewicz J, Huskowska E, Tekenbergs-Hjelte L, Ohlson K, Alminger T, Erickson M, Grundevik I, Hagin I, Hoffman KJ, Johansson S, Larsson S, Löfberg I, Ohlson K, Persson B, Skånberg I, Tekenbergs-Hjelte L (1989) Crystal and molecular structure of sarcosine. Acta Chem Scand 43:1004 [DOI] [PubMed] [Google Scholar]
- 4.Boldyreva EV, Drebushchak VA, Drebushchak TN, Paukov IE, Kovalevskaya YA, Shutova ES (2003) Polymorphism of glycine, part i. J Therm Anal Calorim 73:409 [Google Scholar]
- 5.Dawson A, Allan DR, Belmonte SA, Clark SJ, David WIF, McGregor PA, Parsons S, Pulham CR, Sawyer L (2005) Effect of high pressure on the crystal structures of polymorphs of glycine. Crystal Growth Des 5(4):1415 [Google Scholar]
- 6.Fleck M, Petrosyan AM (2014) Salts of amino acids. Springer International Publishing
- 7.Ilczyszyn M, Godzisz D, Ilczyszyn M (2003) Sarcosine–maleic acid (1:1) crystal: structure, 13c NMR and vibrational properties, protonation character, Spectrochim. Acta A Mol Biomol Spectrosc 59(8):1815 [DOI] [PubMed]
- 8.Jothy VB, Vijayakumar T, Sajan D, Jayakumar VS, Joe IH (2006) Vibrational spectra and ab initio computations of sarcosinium oxalate monohydrate. Laser Phys 16(8):1242 [Google Scholar]
- 9.Sreekumar A, Poisson LM, Rajendiran TM, Khan AP, Cao Q, Yu J, Laxman B, Mehra R, Lonigro RJ, Li Y, Nyati MK, Ahsan A, Kalyana-Sundaram S, Han B, Cao X, Byun J, Omenn GS, Ghosh D, Pennathur S, Alexander DC, Berger A, Shuster JR, Wei JT, Varambally S, Beecher C, Chinnaiyan AM (2009) Metabolomic profiles delineate potential role for sarcosine in prostate cancer progression. Nature 457(7231):910 [DOI] [PMC free article] [PubMed] [Google Scholar] [Research Misconduct Found]
- 10.Struys EA, Heijboer AC, van Moorselaar J, Jakobs C, Blankenstein MA (2010) Serum sarcosine is not a marker for prostate cancer. Ann Clin Biochem Int J Lab Med 47(3):282 [DOI] [PubMed] [Google Scholar]
- 11.Devakirubai IE, Kumar SR, Moses SA, Gunaseelan R (2022) Probing optical (2nd and 3rd order), mechanical and thermal traits of l-arginine hydrochloride monohydrate (LAHCM) NLO crystal for optoelectronics device applications. Mater Today Proc 50:2802 [Google Scholar]
- 12.John JS, Kumar MS, Joy LK, Sajan D, Vinitha G, Vijayan N, John NL (2020) Crystal growth, dielectric studies, charge transfer and ionic hydrogen-bonding interactions of L-arginine hydrobromide monohydrate single crystal: a novel third order nonlinear optical material for optoelectronic applications. Optics Laser Technol 125
- 13.Devi S, Jananakumar D (2021) L-valine doped oxalate single crystals for optoelectronic applications. Chin J Phys 71:159 [Google Scholar]
- 14.Shkir M, Manthrammel MA, Sayed M, Alshahrani T, Yahia I, Ganesh V, Zahran H, Algarni H, AlFaify S (2021) Seed supported solution growth and characterization of L-alanine single crystals for optoelectronics. J Cryst Growth 560–561
- 15.Aarthi J, Dhanasekaran P (2019) Growth, structural, optical, thermal and dielectric properties of L-glutamic acid hydrochloride crystal for optoelectronic device applications. J Cryst Growth 506:79 [Google Scholar]
- 16.Helen F, Kanchana G (2014) Growth and characterization of metal ions doped L-serine NLO single crystals for optoelectronic applications. Optik 125(9):2051 [Google Scholar]
- 17.Santos C, Vasconcelos D, Nogueira C, Freire P, Lima J, Lima R, dos Santos A, Carvalho J, Filho PF (2023) Elucidating L-tyrosine crystal phase transitions by Raman spectroscopy and ab initio calculations. J Phys Chem Solids 176
- 18.Pinho E, Filho JS, Sousa F, Freire P, Lima J, dos Santos A, Filho P (2023) Phase transitions of L-histidinium hydrogen oxalate crystal under high pressures investigated by Raman spectroscopy. Spectrochim Acta A Mol Biomol Spectrosc 298 [DOI] [PubMed]
- 19.Santos C, Lima R, Paraguassu W, da Silva Filho J, dos Santos A, Lima J, Freire P, Filho PF (2021) High-pressures study by Raman spectroscopy and DFT calculations of L-tyrosine hydrobromide crystal. Spectrochim Acta A Mol Biomol Spectrosc 263 [DOI] [PubMed]
- 20.Silva R, de Castro AR, da Silva Filho J, de Sousa F, Paraguassu W, Freire W, Filho PF (2021) Pressure-induced phase transition in glycinium maleate crystal. Spectrochim Acta A Mol Biomol Spectrosc y 262:120076 [DOI] [PubMed] [Google Scholar]
- 21.Losev EA, Zakharov BA, Boldyreva EV (2016) Polymorphic transformations in glycine co-crystals at low temperature and high pressure: two new examples as a follow-up to a glycine–glutaric acid study. CrystEngComm 18(31):5869 [Google Scholar]
- 22.Boldyreva EV, Sowa H, Ahsbahs H, Goryainov SV, Chernyshev VV, Dmitriev VP, Seryotkin YV, Kolesnik EN, Shakhtshneider TP, Ivashevskaya SN, Drebushchak TN (2008) Pressure-induced phase transitions in organic molecular crystals: a combination of X-ray single-crystal and powder diffraction, Raman and IR-spectroscopy. J Phys Conf Ser 121(2)
-
23.Murli C, Sharma SM, Karmakar S, Sikka S (2003)
 -glycine under high pressures: a Raman scattering study. Physica B Condens Matter 339(1):23 [Google Scholar]
 - 24.Sabatini R, Küçükbenli E, Kolb B, Thonhauser T, de Gironcoli S (2012) Structural evolution of amino acid crystals under stress from a non-empirical density functional. J. Phys. Condens. Matter 24(42):424209 [DOI] [PubMed] [Google Scholar]
- 25.Kapustin EA, Minkov VS, Boldyreva EV (2014) Effect of pressure on methylated glycine derivatives: relative roles of hydrogen bonds and steric repulsion of methyl groups. Acta Crystallogr. Sect B Struct Sci Cryst Eng Mater 70:517 [DOI] [PubMed]
- 26.Junior MF, Paraguassu W, dos Santos A, Remédios C (2022) Pressure-induced phase transitions in MBANP crystal: a study by synchrotron radiation X-ray diffraction and Raman spectroscopy. Spectrochim Acta A Mol Biomol Spectrosc 272 [DOI] [PubMed]
- 27.Errandonea D, Meng Y, Somayazulu M, Häusermann D (2005) Pressure-induced transition in titanium metal: a systematic study of the effects of uniaxial stress. Physica B Condens Matter 355(1–4):116 [Google Scholar]
- 28.Klotz S, Chervin JC, Munsch P, Marchand GL (2009) Hydrostatic limits of 11 pressure transmitting media. J Phys D Appl Phys 42(7):075413 [Google Scholar]
- 29.Winkler B, Milman V (2014) Density functional theory based calculations for high pressure research. Z fur Krist - Cryst Mater 229
-
30.Díaz-Anichtchenko D, Gracia L, Errandonea D (2021) Density-functional study of pressure-induced phase transitions and electronic properties of Zn
 V
V O
O . RSC Adv 11:10401
[DOI] [PMC free article] [PubMed] [Google Scholar]
. RSC Adv 11:10401
[DOI] [PMC free article] [PubMed] [Google Scholar] - 31.Wilson CJG, Cervenka T, Wood PA, Parsons S (2022) Behavior of occupied and void space in molecular crystal structures at high pressure. Cryst Growth Des 22:2328 [DOI] [PMC free article] [PubMed] [Google Scholar]
- 32.Rêgo F, Melo F, Nogueira C, Polian A, Freire P, Filho PF, Lima J (2019) High pressure Raman scattering of DL-isoleucine crystals and DFT calculations. Spectrochim Acta A Mol Biomol Spectrosc 214:207 [DOI] [PubMed] [Google Scholar]
- 33.Schatschneider B, Monaco S, Tkatchenko A, Liang JJ (2013) Understanding the structure and electronic properties of molecular crystals under pressure: application of dispersion corrected DFT to oligoacenes. J Phys Chem A 117:8323 [DOI] [PubMed] [Google Scholar]
-
34.Dreger ZA, Tao Y, Averkiev BB, Gupta YM, Klapötke TM (2015) High-pressure stability of energetic crystal of dihydroxylammonium 5, 5
 -bistetrazole-1, 1
 -diolate: Raman spectroscopy and DFT calculations. J Phys Chem B 119:6836
[DOI] [PubMed] [Google Scholar]
-diolate: Raman spectroscopy and DFT calculations. J Phys Chem B 119:6836
[DOI] [PubMed] [Google Scholar] - 35.Tulip PR, Clark SJ (2005) Structural and electronic properties of L-amino acids. Phys Rev B 71(19)
-
36.Flores MZS, Freire VN, dos Santos RP, Farias GA, Caetano EWS, de Oliveira MCF, Fernandez JRL, Scolfaro LMR, Bezerra MJB, Oliveira TM, Bezerra GA, Cavada BS, Alves HWL (2008) Optical absorption and electronic band structure first-principles calculations of
 -glycine crystals. Phys Rev B 77(11)
-
37.Costa SN, Sales FAM, Freire VN, Maia FF, Caetano EWS, Ladeira LO, Albuquerque EL, Fulco UL (2013) L-serine anhydrous crystals: structural, electronic, and optical properties by first-principles calculations, and optical absorption measurement. Crystal Growth Des
 tbf13(7):2793
- 38.Zanatta G, Gottfried C, Silva AM, Caetano EWS, Sales FAM, Freire VN (2014) L-asparagine crystals with wide gap semiconductor features: optical absorption measurements and density functional theory computations. J Chem Phys 140(12) [DOI] [PubMed]
- 39.Araújo RL, Vasconcelos MS, Barboza CA, Neto JXL, Albuquerque EL, Fulco UL (2019) DFT calculations of the structural, electronic, optical and vibrational properties of anhydrous orthorhombic L-threonine crystals. Comput Theor Chem 1170
- 40.Pereira FAR, Macedo-Filho A, Silva AM, Frazão NF, Sarmento RG, Lima KAL, Melo JJS, Junior MLP, Junior LAR, Freire VN (2023) On the structural, electronic, and optical properties of L-histidine crystal: a DFT study. J Mol Model 29(7) [DOI] [PubMed]
- 41.Giannozzi P, Baroni S, Bonini N, Calandra M, Car R, Cavazzoni C, Ceresoli D, Chiarotti GL, Cococcioni M, Dabo I, Corso AD, de Gironcoli S, Fabris S, Fratesi G, Gebauer R, Gerstmann U, Gougoussis C, Kokalj A, Lazzeri M, Martin-Samos L, Marzari N, Mauri F, Mazzarello R, Paolini S, Pasquarello A, Paulatto L, Sbraccia C, Scandolo S, Sclauzero G, Seitsonen AP, Smogunov A, Umari P, Wentzcovitch RM (2009) QUANTUM ESPRESSO: a modular and open-source software project for quantum simulations of materials. J Condens Matter Phys 21(39):395502 [DOI] [PubMed] [Google Scholar]
- 42.Perdew JP, Burke K, Ernzerhof M (1997) Generalized gradient approximation made simple [phys. rev. lett. 77, 3865 (1996)], Phys Rev Lett 78(7):1396 [DOI] [PubMed]
- 43.Perdew JP, Ruzsinszky A, Csonka GI, Vydrov OA, Scuseria GE, Constantin LA, Zhou X, Burke K (2008) Restoring the density-gradient expansion for exchange in solids and surfaces. Phys Rev Lett 100(13) [DOI] [PubMed]
- 44.Perdew JP, Ruzsinszky A, Csonka GI, Vydrov OA, Scuseria GE, Constantin LA, Zhou X, Burke K (2009) Erratum: Restoring the density-gradient expansion for exchange in solids and surfaces. Phys Rev Lett 102(3) [DOI] [PubMed]
- 45.Zhang Y, Yang W (1998) Comment on “generalized gradient approximation made simple.” Phys Rev Lett 80:890 [DOI] [PubMed]
- 46.Dion M, Rydberg H, Schröder E, Langreth DC, Lundqvist BI (2004) Van der waals density functional for general geometries. Phys Rev Lett 92(24) [DOI] [PubMed]
- 47.Grimme S, Ehrlich S, Goerigk L (2011) Effect of the damping function in dispersion corrected density functional theory. J Comput Chem 32(7):1456 [DOI] [PubMed] [Google Scholar]
- 48.Monkhorst HJ, Pack JD (1976) Special points for brillouin-zone integrations. Phys Rev B 13(12):5188 [Google Scholar]
- 49.Angel R (2002) Eosfit version 5.2, virginia tech, Blackburg, VA, USA
- 50.Contreras-García J, Johnson ER, Keinan S, Chaudret R, Piquemal JP, Beratan DN, Yang W (2011) Nciplot: A program for plotting noncovalent interaction regions. J Chem Theory Comput 7(3):625–632 [DOI] [PMC free article] [PubMed] [Google Scholar]
- 51.Lu T, Chen F (2011) Multiwfn: A multifunctional wavefunction analyzer. J Comput Chem 33(5):580 [DOI] [PubMed] [Google Scholar]
- 52.Humphrey W, Dalke A, Schulten K (1996) VMD: Visual molecular dynamics. J Mol Graph 14(1):33 [DOI] [PubMed] [Google Scholar]
- 53.Hyldgaard P, Jiao Y, Shukla V (2020) Screening nature of the van der waals density functional method: a review and analysis of the many-body physics foundation. J Phys Condens Matter 32(39):393001 [DOI] [PubMed] [Google Scholar]
- 54.Prazyan TL, Zhuravlev YN, Golovko OV, Obolonskaya OS (2019) DFT-study of pressure-induced phase transition in l-threonine. J Mol Struct 1196:271 [Google Scholar]
-
55.Lu LY, Wei DQ, Chen XR, Lian D, Ji GF, Zhang QM, Gong ZZ (2008) The first principle studies of the structural and vibrational properties of solid
 -HMX under compression. Mol Phys 106(21):2569 [Google Scholar]
 - 56.Silinsh EA (2012) Organic molecular crystals: their electronic states. vol 16. Springer Science & Business Media
- 57.Eberheim K, Dues C, Attaccalite C, Müller MJ, Schwan S, Mollenhauer D, Chatterjee S, Sanna S (2022) Tetraphenyl tetrel molecules and molecular crystals: From structural properties to nonlinear optics. J Phys Chem C 126:3713 [Google Scholar]
- 58.Cândido-Júnior J, Sales F, Costa S, de Lima-Neto P, Azevedo D, Caetano E, Albuquerque E, Freire V (2011) Monoclinic and orthorhombic cysteine crystals are small gap insulators. Chem Phys Lett 512(4–6):208 [Google Scholar]
- 59.Andrade-Filho T, Ferreira FF, Alves WA, Rocha AR (2013) The effects of water molecules on the electronic and structural properties of peptide nanotubes. Phys Chem Chem Phys 15:7555 [DOI] [PubMed] [Google Scholar]
- 60.de Souza Freitas HA, Neto AMC, de Sousa FF, Amorim RG, Gester R, Stoyanov SR, Rocha AR, Andrade-Filho T (2021) Hydration-dependent band gap tunability of self-assembled phenylalanyl tryptophan nanotubes. Physica E 134:114910 [Google Scholar]
-
61.Benyahlou ZD, Baara FT, Yahiaoui S, Megrouss Y, Boukabcha N, Djafri A, Chouaih A, Hatzidimitriou A (2023) Synthesis, crystal structure, hirshfeld surface, energy framework, NCI-RDG, theoretical calculations and molecular docking of (z)4, 4
 -bis[-3-n-ethyl-2-n’-(phenylimino) thiazolidin-4-one] methane. J Mol Struct 1277:134781 [Google Scholar]
 - 62.Saikia J, Devi T, Karlo T (2023) A combined spectroscopic and quantum chemical approach to study the molecular interaction between anti-inflammatory drug hydrocortisone and amino acid l-phenylalanine. J Mol Struct 1286:135546
- 63.Soumya S, Joe IH (2021) A combined experimental and quantum chemical study on molecular structure, spectroscopic properties and biological activity of anti-inflammatory glucocorticosteroid drug, dexamethasone. J Mol Struct 1245:130999
- 64.Kapustin EA, Minkov VS, Boldyreva EV (2015) Sarcosine and betaine crystals upon cooling: structural motifs unstable at high pressure become stable at low temperatures. Phys Chem Chem Phys 17(5):3534 [DOI] [PubMed] [Google Scholar]
- 65.Perevoshchikov AV, Maksimov AI, Kovalenko NA, Uspenskaya IA (2022) Equations of state for a crystalline phase: Contemporary models. Russ J Phys Chem A 96(10):2059 [Google Scholar]
- 66.Funnell NP, Dawson A, Francis D, Lennie AR, Marshall WG, Moggach SA, Warren JE, Parsons S (2010) The effect of pressure on the crystal structure of l-alanine. CrystEngComm 12(9):2573
- 67.Fedorov AY, Rychkov DA, Losev EA, Zakharov BA, Stare J, Boldyreva EV (2017) Effect of pressure on two polymorphs of tolazamide: why no interconversion? CrystEngComm 19(16):2243 [Google Scholar]
- 68.Prasanna R, Gold-Parker A, Leijtens T, Conings B, Babayigit A, Boyen HG, Toney MF, McGehee MD (2017) Band gap tuning via lattice contraction and octahedral tilting in perovskite materials for photovoltaics. J Amer Chem Soc 139:11117 [DOI] [PubMed] [Google Scholar]
- 69.Huang Y, Wang L, Ma Z, Wang F (2018) Pressure-induced band structure evolution of halide perovskites: A first-principles atomic and electronic structure study. J Phys Chem C 123:739 [Google Scholar]
Associated Data
This section collects any data citations, data availability statements, or supplementary materials included in this article.
Supplementary Materials
Data Availability Statement
If requested.