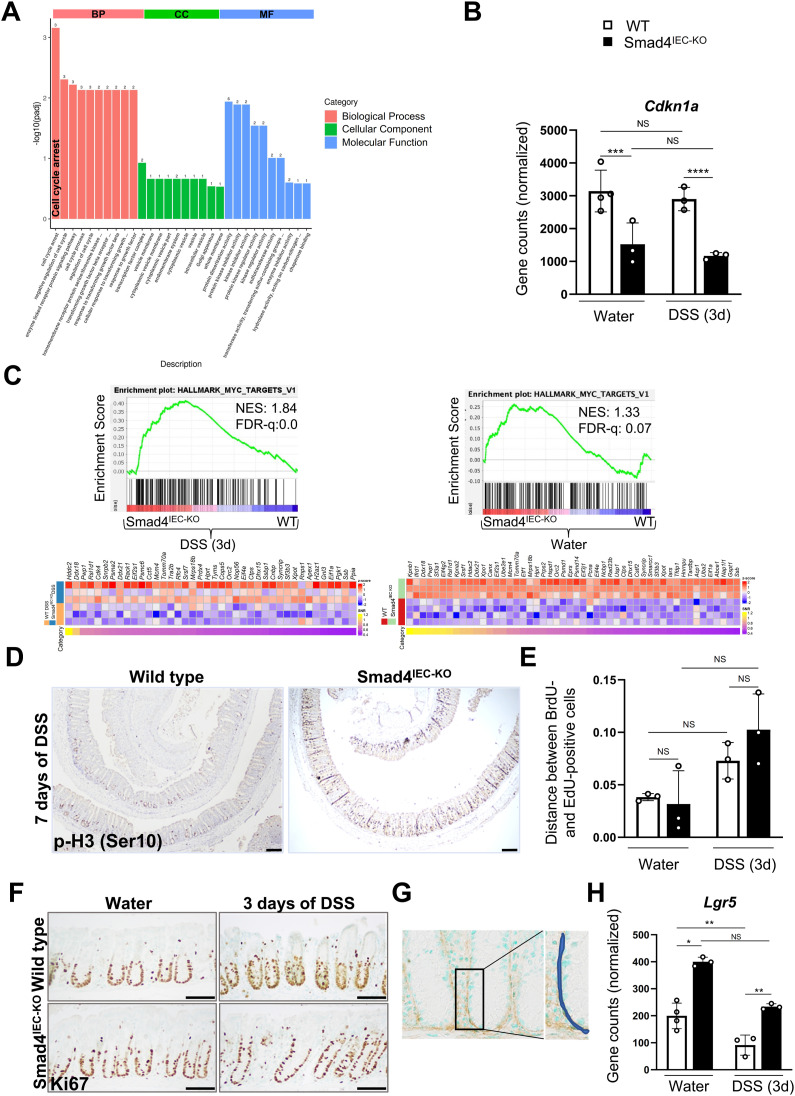
Figure S2. Transcriptomic changes indicating decreased proliferation in the 3-d post-DSS WT colonic epithelium.
(A) Top-enriched Gene Ontology terms among the down-regulated gene sets, suggesting interrupted proliferation in the 3-d post-DSS WT epithelium compared with the DSS-treated Smad4IEC−KO colon epithelium (n = 3 replicates/group). (B) Reduced Cdkn1a transcript levels in the 3-d post-DSS Smad4IEC−KO colon epithelium (n = 4 replicates/water-treated WT and 3 replicates/other groups); Padj. values obtained from DEG analysis were used to determine the statistical significance. (C) GSEA plot showing gene signatures of Myc targets in the 3-d post-DSS Smad4IEC−KO colon epithelium compared with it WT counterpart; the corresponding heatmap shows the core-enriched genes (n = 3 replicates/group). The GSEA plot showing enrichment of Myc targets in the Smad4IEC−KO colon epithelium compared with it WT counterpart and its corresponding heatmap (n = 4 replicates/water-treated WT and 3 replicates/Smad4IEC−KO). (D) p-H3 (Ser10) IHC showing proliferating crypt epithelial cells in the G2/M phase of cell cycle (n = 3 replicates/group); scale bars, 100 μm. (E) Migration assessed by the relative distance between the top-most BrdU- and the top-most EdU-positive cells within the same crypt; the x-axis represents the ratio of the migratory distance relative to the crypt height (n = 3 replicates/group). (F) Representative images of Ki67 IHC showing the proliferative zone within the crypts (n = 3 replicates/group); scale bars, 50 μm. (G) Schema showing the region accounted to quantify type I collagen in the epithelial ECM. (H) Increased Lgr5 transcript levels in the DSS-treated and water-only Smad4IEC−KO colon epithelium (n = 4 replicates/water-treated WT and 3 replicates/other groups); Padj. values obtained from DEG analysis were used to determine the statistical significance. (n = 4 replicates/water-treated WT and 3 replicates/other groups); Padj. values obtained from DEG analysis were used to determine the statistical significance. All experiments in (D, E, F) were n = 3 independent experiments. In (B), Padj. values obtained from DEG analysis were used to determine the statistical significance. In (E), data are presented as the mean ± SEM. Statistical significance was determined using an unpaired two-tailed t test. NS, not significant. *** and **** denote P < 0.001 and P < 0.0001, respectively. NES = normalized enrichment score, FDR-q = false discovery rate q-value.

