Table 1.
Summary of in vitro JNK1 PhALC (with 10 mM GSH), cell-based JNK1 NanoBRET target engagement (HEK293) and p-c-Jun EC50 measurements (SH-SY5Y MKK7 ACT cells)
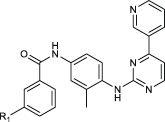 |
R1 | PhAlc IC50 /(nM) | NanoBRET EC50/(nM) | HTRF p-c-Jun(S63) EC50/(nM) | Western blot p-c-Jun (S73) EC50/(nM) |
|---|---|---|---|---|---|
| IN-8 | 3805 ± 402 | 417 ± 38 | 2127 ± 135 | 8975 ± 2680 | |
| IN-8a |  |
5333 ± 232 | x | 6792 ± 256 | n.a. |
| JNK-IN-8 | 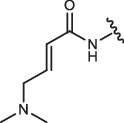 |
44 ± 6 | 10.5 ± 0.5 | 88 ± 8 | 760 ± 120 |
| CA-IN-8 | 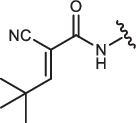 |
318 ± 45 | 166 ± 35 | 4970 ± 620 | 8624 ± 1973 |
| 1aR-IN-8 | 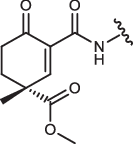 |
22 ± 6 | 11.5 ± 0.7 | 135 ± 15 | 660 ± 100 |
| 1aS-IN-8 | 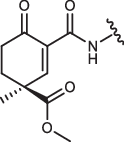 |
30 ± 5 | 3.3 ± 1.7 | 65 ± 7 | 320 ± 120a |
| 1a’R-IN-8 | 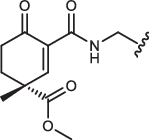 |
225 ± 17 | 1060 ± 150 | 747 ± 247 | 4320 ± 1380 |
| 1a”-IN-8 | 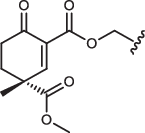 |
349 ± 24 | 650 ± 180 | 644 ± 110 | 7330 ± 3600a |
| 2-IN-8 |  |
780 ± 159 | 76 ± 30 | 616 ± 169 | 3350 ± 370a |
| 3-IN-8 | 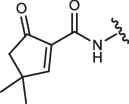 |
254 ± 55 | 240 ± 70 | 378 ± 108 | 6710 ± 980a |
| 4-IN-8 | 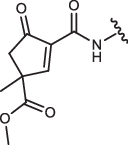 |
37 ± 4 | 9.4 ± 0.4 | 220 ± 25 | n.a. |
| 5S-IN-8 | 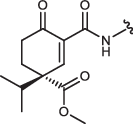 |
641 ± 126 | n.a. | n.a. | n.a. |
| 5R-IN-8 | 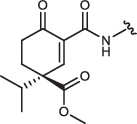 |
537 ± 131 | n.a. | n.a. | n.a. |
| 6S,S-IN-8 | 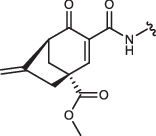 |
59 ± 4 | n.a. | n.a. | n.a. |
| 6 R,R-IN-8 | 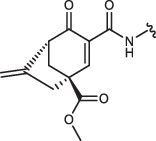 |
128 ± 3 | n.a. | n.a. | n.a. |
The p-c-Jun EC50 values were determined with two different methods, by an HTRF based assay with a p-c-Jun(Ser63) antibody or by the classical western blot based method with a p-c-Jun(Ser73) antibody; and the Pearson coefficient (0.68) calculated with the nine data points indicated a strong positive correlation between these two methods as expected. JNK activation was induced by doxycycline treatment in both cases and inhibitors were co-administered with the inducer and the respective p-c-Jun signal was measured after 6 h.
(Data show the mean ± parameter error estimate from weighted least squares method; for NanoBRET n = 2; for other measurements n = 3, independent experiments, except for a where n = 1; n.a.: not available, not measured; x denotes that target engagement with NanoLuc-JNK1 could not be quantitatively measured due to lack of change in the BRET signal; Supplementary Fig. 1, 6, 7 and 8).
