
Fig. 2.
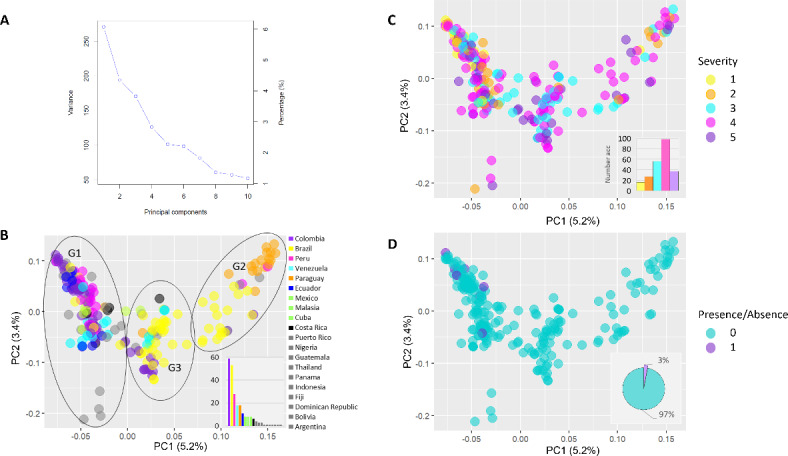
Plots of the two principal components (PCs) showing the distribution of accessions in PC1 and PC2. (A) depicts the variance explained by the first ten principal components and their respective percentages. In (B), colors represent the country of origin of each accession, with three major groups shown within circles (G1, G2, and G3). (C) indicates colors corresponding to the five-point scale of CBSD symptom severity phenotype as determined by Sheat et al. (2019)22. Similarly, colors in (D) represent the presence or absence of the CBSV-Mo83 virus isolate as reported by the same authors.