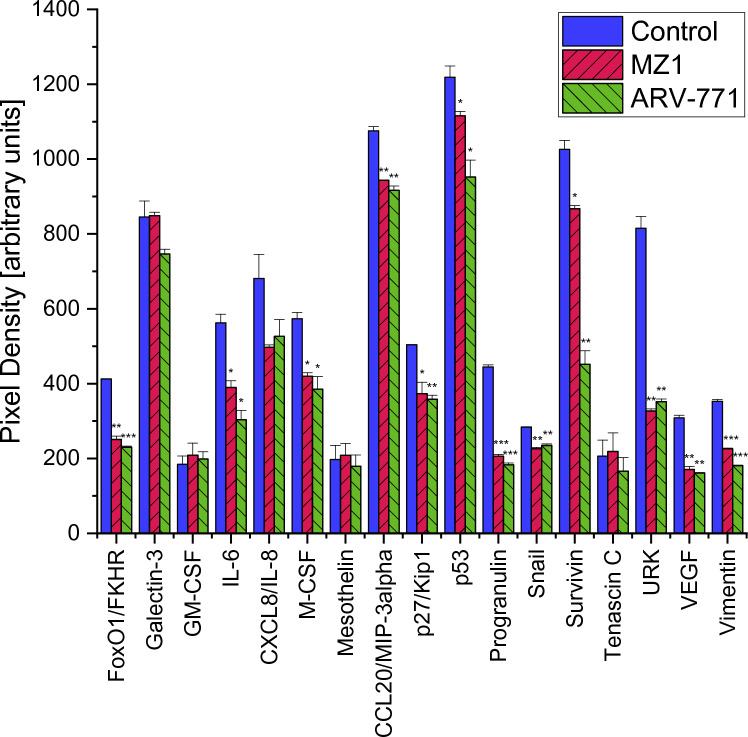
Fig. 8.
Additionally to the comparison with MDA-MB-231, significant changes in protein expression of MDA-MB-436 are shown in this graph. Part 3 of the analysis of cancer-related proteins in MDA-MB-436 following the exposure to 0.2 µM MZ1 and ARV-771. Data represent mean values ± SD. Significant p-values are indicated by *(p < 0.05), **(p < 0.01) and ***(p < 0.001). HIF-1alpha Hypoxia Inducible Factor 1 Subunit Alpha, HNF-3beta Forkhead Box A2, MUC-1 Mucin 1 Cell Surface Associated, Serpin B5/Maspin Serpin Family B Member 5, SerpinE1/PAI-1 Serpin Family E Member 1

