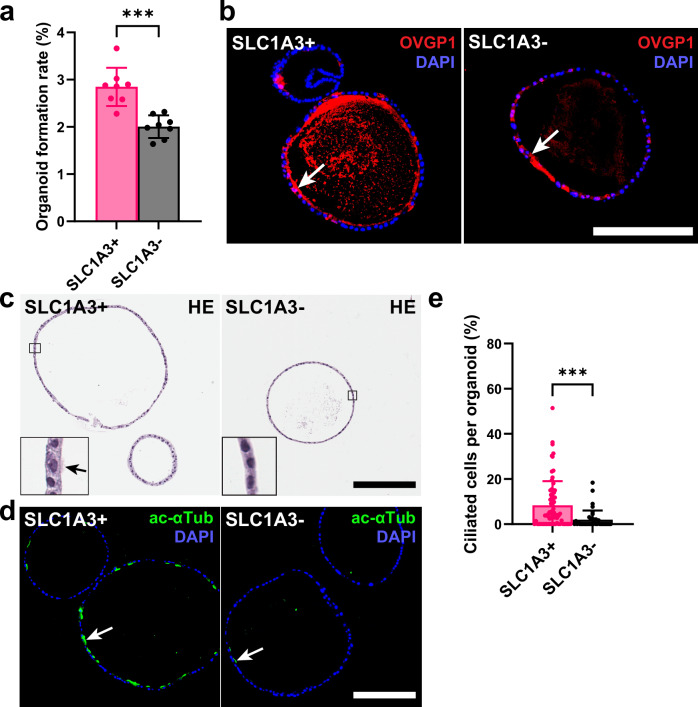
Fig. 4. Organoid formation by SLC1A3+ and SLC1A3- cells.
a Organoid formation rate of distal tubal epithelial cells isolated for SLC1A3 expression by MACS (n = 8). b Organoid sections of day 14 SLC1A3+ and SLC1A3- cell derived organoids stained for secretory marker OVGP1 (red, arrows). Counterstaining with DAPI (blue). c Hematoxylin and Eosin (HE) staining of SLC1A3+ and SLC1A3- cell derived organoids after 14 days of culture. Arrow denotes cilia. d Representative images of ciliation (green, acetylated α-Tubulin) between SLC1A3+ and SLC1A3- cell derived organoids. Counterstaining with DAPI (blue). b–d Scale bar all images 200 μm. e Quantification of ciliated cells between SLC1A3+ (n = 71) and SLC1A3- (n = 40) cell derived organoids. a, e ***P = 0.0002, ****P = 0.0005, two-tailed unpaired t-tests. Data are presented as mean values ± SD. Source data are provided as a Source Data file.

