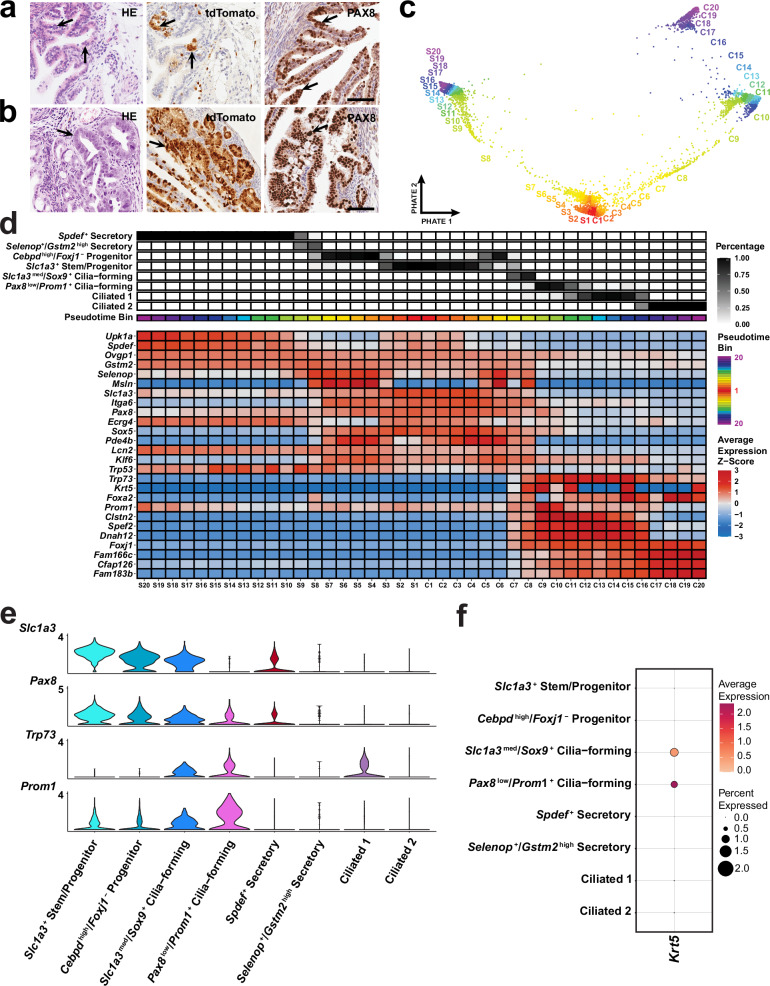
Fig. 6. Identification of cancer-prone cell states.
Early (a) and advanced (b) neoplastic lesions (arrows) in Pax8-rtTA Tre-Cre Trp53loxP/loxP Rb1loxP/loxP Ai9 mice. Hematoxylin and Eosin (HE) staining (left column) and immunostaining for tdTomato (middle column, brown color), and PAX8 (right column, brown color). Elite ABC method, hematoxylin counterstaining. a, b Scale bar, all images 60 µm. Biological replicates n = 6 (a) and n = 3 (b). c Pseudotime binning along the PHATE embedding to visualize how bins are assigned for 6,273 distal epithelial cells from 62 uterine tubes. d Inferred pseudotime trajectories of secretory and ciliated epithelial cell lineages. The lineages extend from S1 and C1 to S20 and C20 respectively, where S20 and C20 are presumed to be a more differentiated cell state. The percent abundance of each cell type contributing to each pseudotime bin is reflected in black. The average z-scored expression was calculated for each gene to identify genes that best represent smaller transitional states within each lineage. Each pseudotime bin is equally sized and consists of about 150 cells. e Log-normalized expression of Slc1a3, Pax8, Trp53 and Prom1 visualized in a violin plot of epithelial cell clusters. f Dot plot of Krt5 expression among epithelial cell populations. Source data are provided as a Source Data file.

