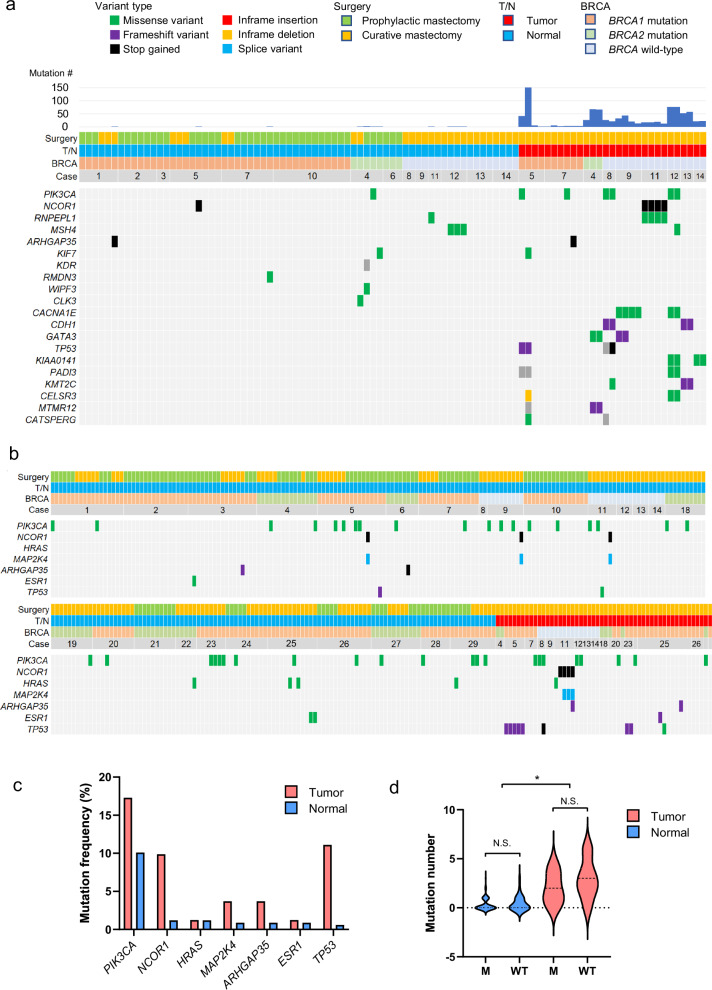
Fig. 2. Mutational profile of macroscopically normal breast tissues and breast cancer tissues.
a Frequently mutated genes by WES with color coding of their alteration status for each tumor. The case number, BRCA status, sample origin, types of surgery, and total mutation number are shown at the top. b Frequently mutated genes by TOP panel with color coding of their alteration status for each tumor. The case number, BRCA status, sample origin, and types of surgery are shown at the top. The blank case numbers are 19, 22, 24, 27, and 29 in order. c Oncogenic mutations frequently identified in macroscopically normal breast tissues and breast cancer tissues. d The mutation number was compared between tumor and normal samples, and between samples with BRCA1/2 mutations and wild-type BRCA. The dotted lines in the violin plot indicate the average. N.S. not significant, *p < 0.05, student’s t test.

