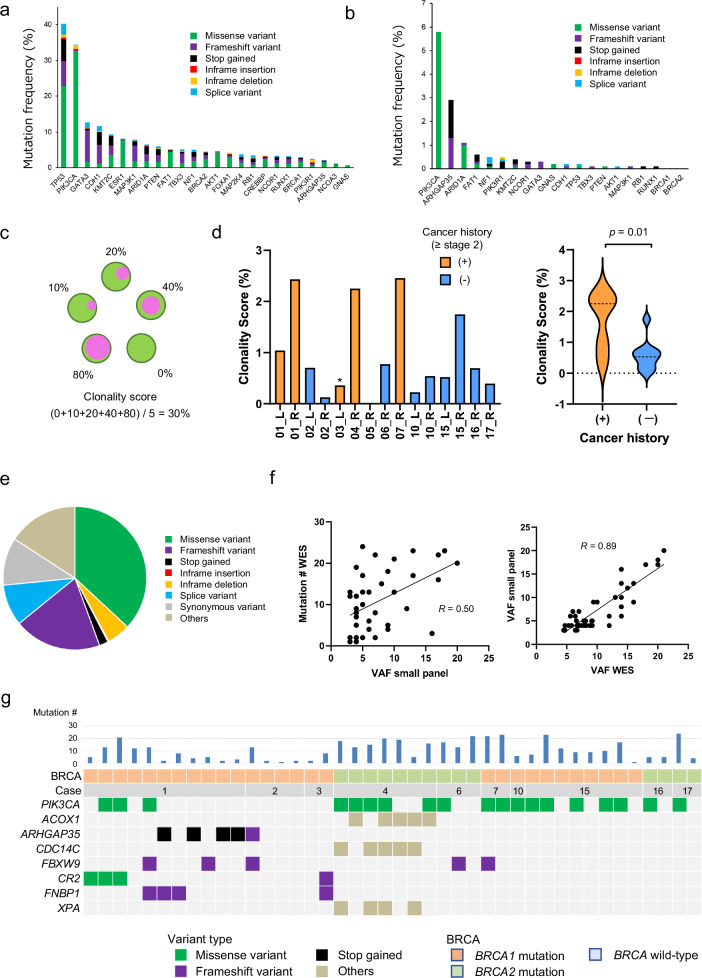
Fig. 3. Mutational profile using BCP and its correlation with WES.
a The mutation frequency of the 25 breast cancer-related genes in the GENIE database. The mutation frequencies in the breast cancer cohort in GENIE database are indicated as bar graphs with the variant type categories. b The mutation frequency of the 25 breast cancer-related genes identified in macroscopically normal breast tissues. The mutation frequencies in macroscopically normal breast tissues of this study are indicated as bar graphs with the variant type categories. c The scheme depicts the concept of clonality score, which is defined as the average of the clonal cell fraction in the samples of individual breast. For instance, the clonality score of the breast in which the clonal cell fractions in five samples are 0, 10, 20, 40, and 80% is (0 + 10 + 20 + 40 + 80)/5 = 30%. d The clonality score for 15 individual breasts from 11 patients is shown as bar graphs on the left. *; this breast was resected one month after NAC. The clonality scores were compared between samples from breasts with and without a history of breast cancer, and revealed as violin plots on the right (average; 1.71 vs. 0.57, p = 0.01, student’s t test). e The distribution of the variant types of 451 mutations identified by WES in 42 macroscopically normal breast samples from 10 patients harboring mutations with VAF (>3%). f The correlation between the mutation number identified by WES and highest VAF values identified by BCP is shown on the left. The correlation between the highest VAF identified by WES and that by small panel is shown on the right. g Frequently mutated genes identified by WES in 42 macroscopically normal breast samples with color coding of their variant types. The case number, BRCA status, and total mutation number are shown at the top.

