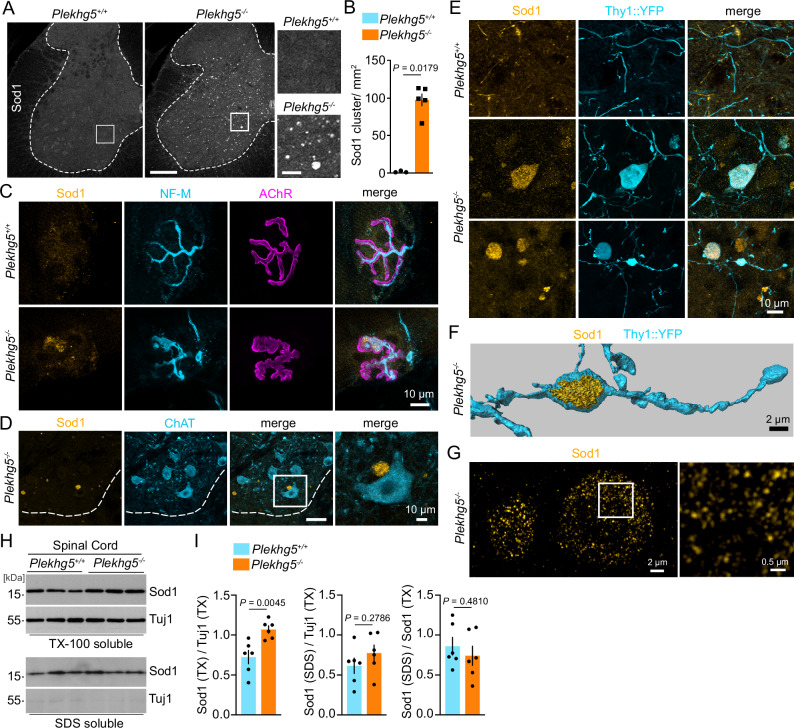
Fig. 1. Plekhg5 regulates the secretion of Sod1.
A Representative images of spinal cord cross sections from Plekhg5+/+ and Plekhg5−/− mice stained for Sod1. Numerous accumulations of Sod1were present in spinal cord cross sections from Plekhg5−/− mice. Scale bar: 200 µm. Scale bar, inset: 40 µm. B Quantification of Sod1 accumulations in spinal cord cross sections. Plekhg5+/+ mice, n = 3; Plekhg5−/− mice, n = 5; biological replicates. 7 sections were analyzed per mouse. Mann-Whitney test, one-tailed. C NMJ within the gastrocnemius visualized by BTX and NF-M staining. Note the Sod1 accumulation at the axon terminal of Plekhg5−/− mice. The images are representative of at three biological replicates. D Spinal cord cross-section of Plekhg5−/− stained for Sod1 and ChAT showing a Sod1 accumulation close to the soma of a MN. The images are representative of two biological replicates. Scale bar: 40 µm. Scale bar, inset: 10 µm. E Spinal cord cross-sections of Plekhg5−/− Thy1::YFP mice stained for Sod1 and GFP reveal the localization of Sod1 accumulations in distal parts of axons. The images are representative of three biological replicates. F Imaris 3D reconstruction of the image shown in the lower panel of E. G SIM microscopy of Sod1 accumulations in the spinal cord of Plekhg5-deficient mice. At high resolution Sod1 accumulations appeared as clusters of individual Sod1+ structures. The images are representative of three biological replicates. H Accumulation of Triton-X-100 soluble Sod1 in spinal cords of Plekhg5−/− mice. Spinal cord homogenates were separated into Triton-X-100-soluble and SDS-soluble fractions and analyzed by Western blot. I Quantification of the Sod1 levels in the Triton-X-100-soluble and SDS-soluble fractions of Plekhg5−/− and Plekhg5+/+ mice. n = 6 biological replicates; t-Test, two-tailed. Data are mean ± SEM. Source data are provided as a source data file.

