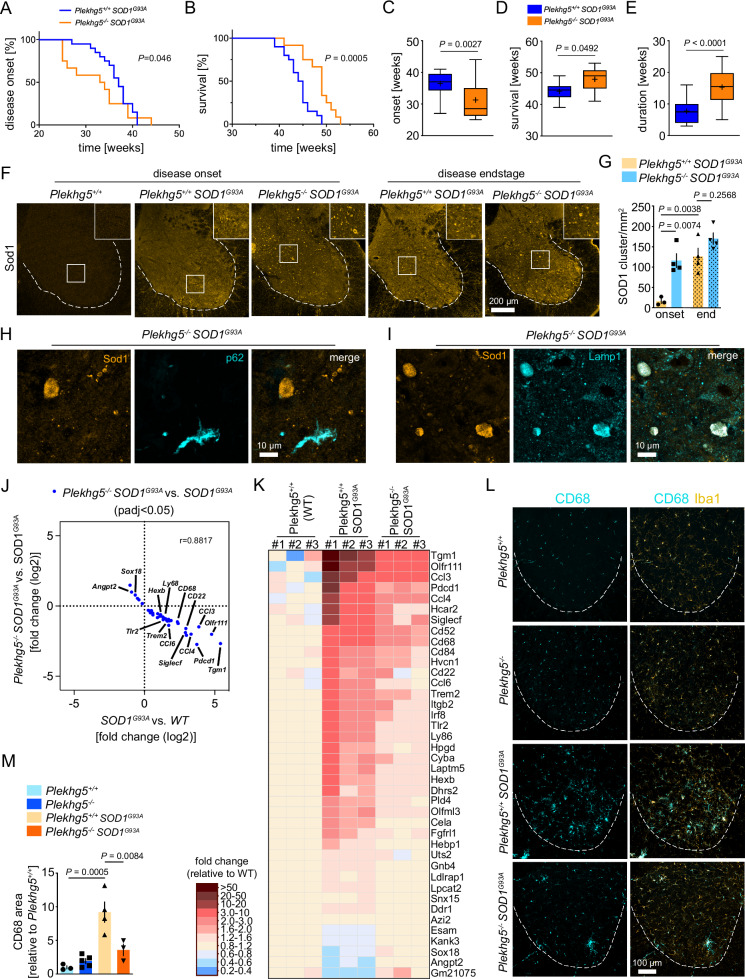
Fig. 6. Depletion of Plekhg5 in SOD1G93A mice prepones the disease onset but extends the survival.
Kaplan–Meier plots showing the onset of weight loss (A) and survival (B) of Plekhg5−/− Sod1G93A mice compared to Plekhg5+/+ Sod1G93A. Log-rank (Mantel Cox) test. Average disease onset (C), survival (D), and duration (E). A, C Plekhg5+/+ Sod1G93A, n = 20. Plekhg5−/− Sod1G93A, n = 16. B, D, E Plekhg5+/+ Sod1G93A, n = 20. Plekhg5−/− Sod1G93A, n = 12; biological replicates. Two-tailed t-test. Box bounds are defined by min to max. Whiskers represent data points within 1.5 IQR. Lines and crosses denote the median and mean. F Sod1 staining of spinal cord cross sections revealed an accelerated accumulation of Sod1 in Sod1G93A mice upon depletion of Plekhg5. G Quantification of Sod1 accumulations. Onset: Plekhg5+/+ Sod1G93A, n = 3; Plekhg5−/− Sod1G93A, n = 4; biological replicates. Endstage: Plekhg5+/+ Sod1G93A, n = 4; Plekhg5−/− Sod1G93A, n = 4; biological replicates. One-way ANOVA; Tukey’s Multiple Comparisons. Sod1 accumulations in Plekhg5 −/− Sod1G93A mice stain negative for p62 (H) but positive for Lamp1 (I). The images are representative of three biological replicates. J Scatterplot showing the magnitude of change (fold change, log2) of the transcripts significantly altered in SOD1G93A vs. wildtype (WT) mice and significantly altered in SOD1G93A mice vs. Plekhg5−/− SOD1G93A. n = 3 biological replicates. Pearson correlation, r = −0.9390. K Heat Map showing the relative expression levels of transcripts significantly altered in SOD1G93A vs. Plekhg5+/+ (WT) mice and significantly altered in SOD1G93A mice vs. Plekhg5−/−SOD1G93A. The expression levels are shown as fold change of the normalized read counts adjusted to the mean levels of Plekhg5+/+ (WT) mice. L Staining for Iba1 and CD68 in spinal cord cross-sections revealed a reduced microglial neuroinflammation in Plekhg5−/− Sod1G93A mice. M Quantification of the CD68 immunoreactivity area. Plekhg5+/+, n = 3; Plekhg5−/−, n = 5; Plekhg5+/+ Sod1G93A, n = 4; Plekhg5−/− Sod1G93A, n = 3; biological replicates. One-way ANOVA; Tukey’s Multiple Comparisons. Data are mean ± SEM. Source data are provided as a Source Data file.

