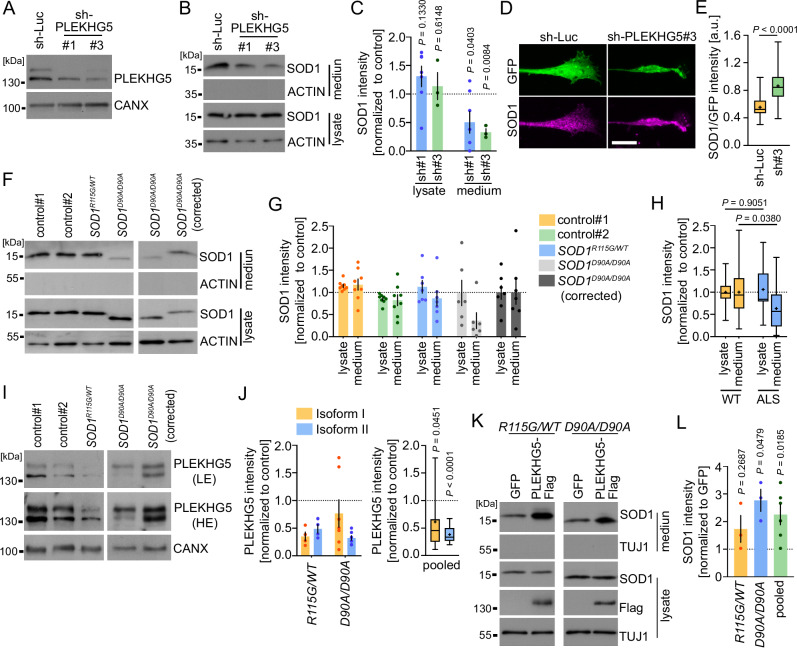
Fig. 7. PLEKHG5 drives the secretion of mutant ALS-linked SOD1 in human iPSC-derived MNs.
A Western blot showing the knockdown of PLEKHG5 in hiPSC-derived MNs (sh-RNA-1 = #1; sh-RNA-3 = #3). The images are representative of two biological replicates. B Western blot showing reduced SOD1 levels in the medium of PLEKHG5-depleted MNs. C Western blot quantification of the SOD1 intensities. One sample t-test, two-tailed. sh#1, n = 6; sh#3 n = 3; biological replicates. D Immunoreactivity of SOD1 in axon terminals of control or PLEKH5-depleted hiPSC-derived MNs. Scale bar: 10 µm. E Quantification of the SOD1 intensity normalized to GFP. sh-Luc, n = 48; sh-PLEKHG5, n = 52. Three biological replicates. Two-tailed test, unpaired. F Western blots showing reduced SOD1 levels in the medium of iPSC-derived MNs with mutant ALS-linked SOD1. G, H Western blot quantification of the SOD1 intensity. G Individual data: control#1, n = 8; control#2, n = 8; SOD1R115G/WT, n = 7; SOD1D90A/D90A, n = 6; SOD1D90A/D90A (corrected); biological replicates. H Pooled data: WT, n = 23; ALS, n = 13; biological replicates. Two-way ANOVA, Sidak’s multiple comparison test. I Western blots showing reduced PLEKHG5 levels in the lysates of SOD1D90A/D90A and SOD1R115G/WT MNs. J Western blot quantification of the PLEKHG5 intensity relative to CANX. SOD1R115G/WT, n = 4; SOD1D90A/D90A, n = 7. Pooled, n = 11; biological replicates. One sample t-test, two-tailed. LE low exposure, HE high exposure. K Expression of Flag-Plekhg5 (Isoform 1) caused an increase in the media of mutant ALS-linked SOD1 as shown by Western blot. L Western blot quantification of the SOD1intensities. SOD1R115G/WT, n = 3; SOD1D90A/D90A, n = 3; Pooled, n = 6; biological replicates. One sample t-test, two-tailed. Quantification of SOD1 secretion was calculated as the ratio between the amount of SOD1 in the medium and in the lysate. The SOD1 levels in the lysates were adjusted to CANX. The SOD1 or PLEKHG5 levels of SOD1R115G/WT MNs were normalized to the mean value of both controls. The intensities of SOD1D90A/D90A MNs were normalized to their corrected counterpart. The normalized SOD1 intensities were set to 1 in each experiment. Data are mean ± SEM. Box bounds are defined by min to max. Whiskers represent data points within 1.5 IQR. Lines and crosses denote the median and mean. Source data are provided as a Source Data file.

