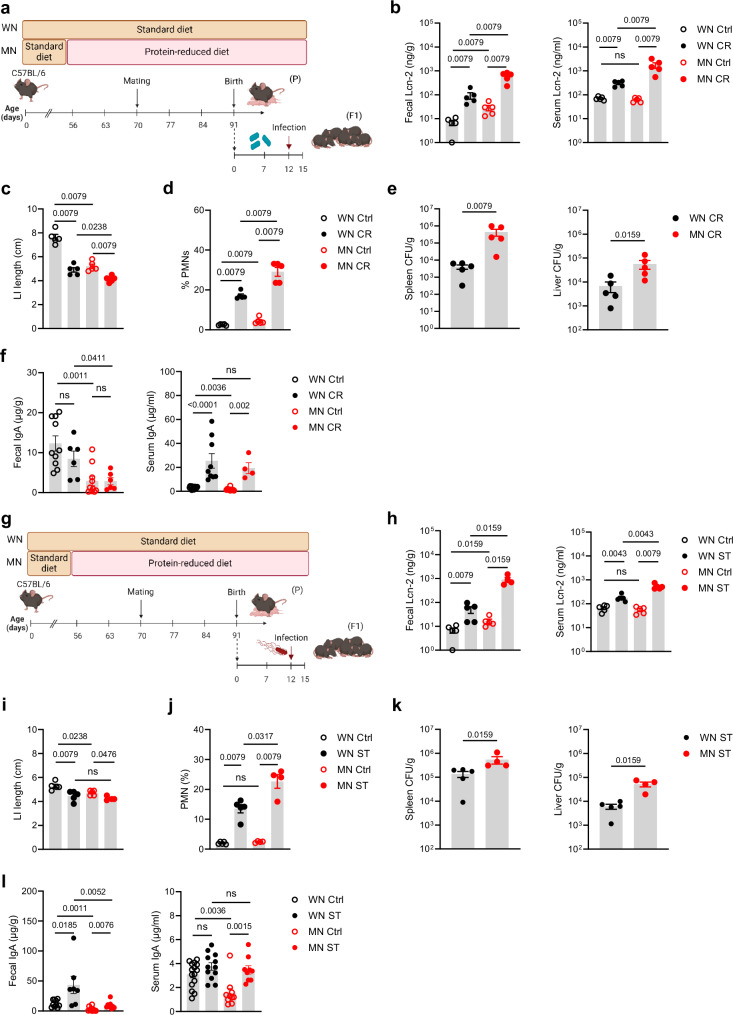
Fig. 2. The early-life enteropathy established under maternal malnutrition aggravates subsequent enteric infections.
a Experimental setup of the C. rodentium infection model. b–f The offsprings of the MN and WN group were infected at d12 after birth with C. rodentium (CR) or treated with PBS (control, Ctrl). Biosamples were harvested 10 days post infection (p.i.). g Experimental setup of the S. typhimurium infection model. h–l The offsprings of the MN and WN group were infected at d12 after birth with S. typhimurium (ST) or treated with PBS (Ctrl). Biosamples were harvested 3 days p.i. b, h Fecal and serum Lcn-2 levels, respectively (n = 5 each group). c, i LI length (n = 5 each group). d, j Proportions of PMNs from LI LMPCs (n = 5 each group). e, k Bacterial load in spleens and livers of infected mice plotted as colony-forming units (CFU) per organ weight (n = 5 each group). f, l Fecal (Ctrl groups: n = 10, infected groups MN: n = 6-9) and serum total IgA levels (Ctrl WN: n = 15, Ctrl MN: n = 10; infected groups: WN: n = 9, MN: n = 4 (CR) or n = 9 (ST)), respectively. Plots represent means ± SEM. Exact p-values are displayed, ns, not significant (two-tailed MWU-tests). Panel a and g were created in BioRender under license number BioRender.com/z09x085.

