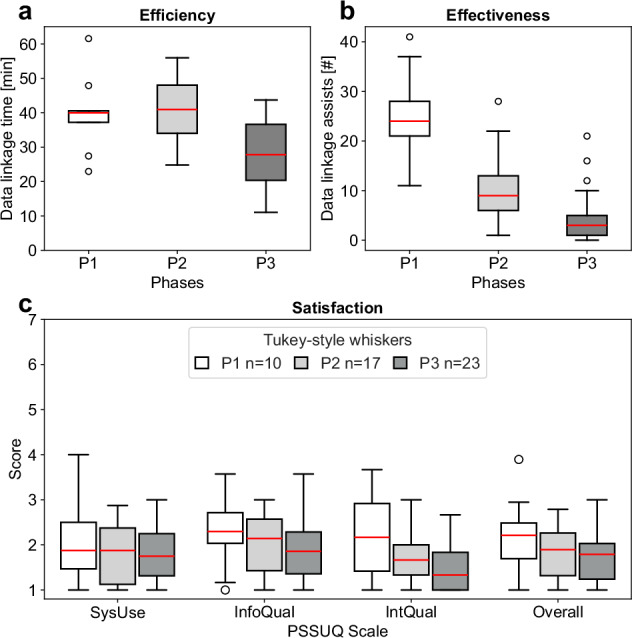
Fig. 3. Progression of the comparable quantitative metrics for usability collected in the Phase 1, 2 and 3 of the evaluation.

The participants denoted by n refer to the number of health data researchers that participated in each of the evaluation phases (P1, white, n = 10; P2, grey, n = 17; P3, dark grey, n = 23). a Efficiency: time spent per participant during the data linkage tasks. b Effectiveness: number of assists from the moderator during the data linkage tasks. c Satisfaction: Post-Study System Usability Questionnaire (PSSUQ v2) results for the System Usefulness (SysUse), Information Quality (InfoQual), Interface Quality (IntQual) and Overall scales. The lower the value of the quantitative metrics, the higher the usability.
