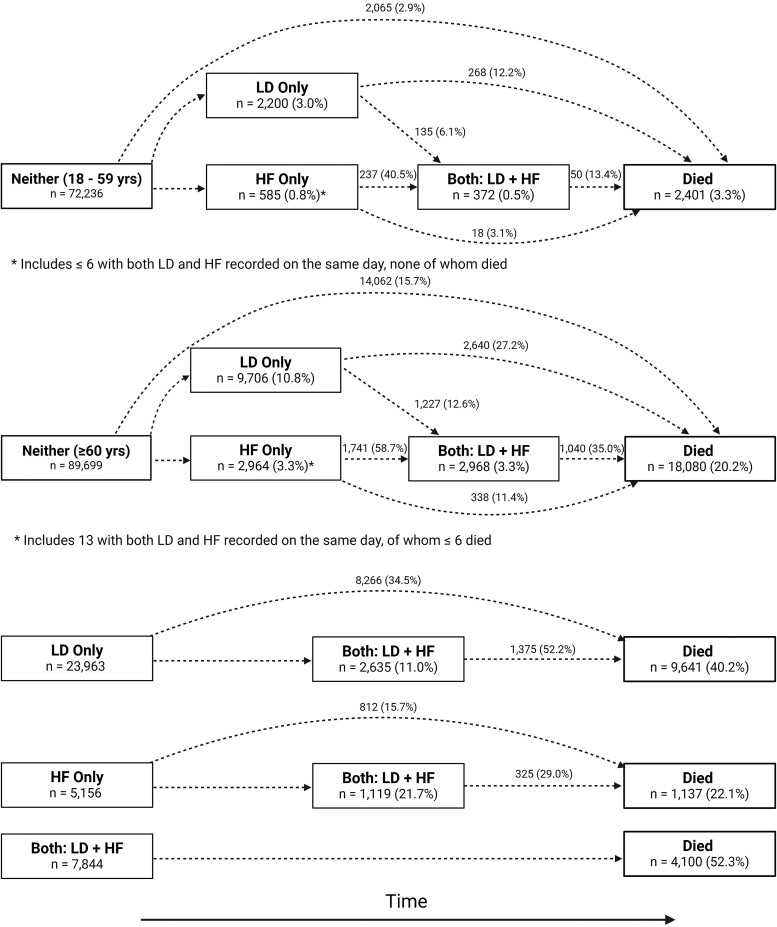
Figure 2.
Transition diagrams show how many patients started in each of the four groups (left most boxes) and how many experienced subsequent events between 1 January 2012 and 31 December 2016. Percentages in the boxes are calculated with the baseline group size as the denominator, while transitions are calculated based on those eligible for each transition. Reasons for transitions include diagnosis of heart failure, initiation of loop diuretics, or death during follow-up

